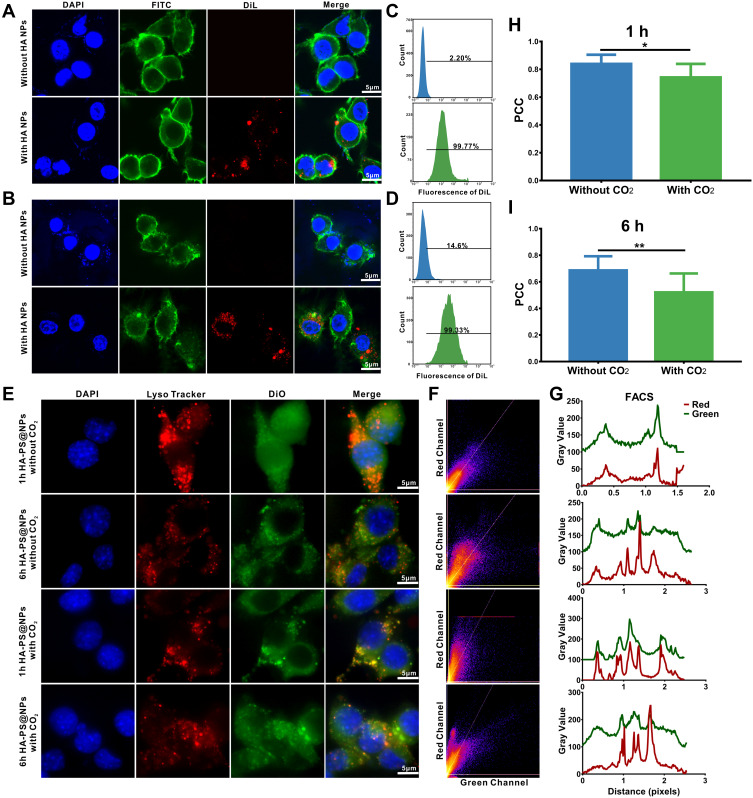
Figure 3.
Cellular uptake of nanoparticles and low pH-activated lysosomal escape of HA-PS@NPs. (A) Colon-26 cells were incubated with DiL-labeled HA NPs, then stained by FITC-phalloidin and DAPI to visualize cytoskeleton and nucleus, respectively. (B) Raw 264.7 cells were incubated with DiL-labeled HA-NPs, then stained by FITC-phalloidin and DAPI to visualize cytoskeleton and nucleus, respectively. (C) Colon-26 cells uptake efficiency of NPs and HA NPs were measured using flow cytometry. (D) Raw 264.7 cells uptake efficiency of HA NPs were measured using flow cytometry. (E) Representative images of Colon-26 cells incubated with HA-PS@NPs with CO2 and HA-PS@NPs without CO2 for 1 h and 6 h at 37°C. The cell nuclei were stained by DAPI (blue), the lysosomes were stained by LysoTracker Red (red), and HA-PS@NPs were labeled with DiO (green). (F) Color scatter plots of HA-PS@NPs vs lysosomes. (G) Plot profiles of HA-PS@NPs vs lysosomes. (H–I) Corresponding Pearson’s correlation coefficient (PCC) values of HA-PS@NPs vs lysosomes (mean ± standard deviation, n > 10) at 1h and 6h. *P < 0.05, **P < 0.01 with 95% confidence level from the unpaired t-test.

