FIGURE 4.

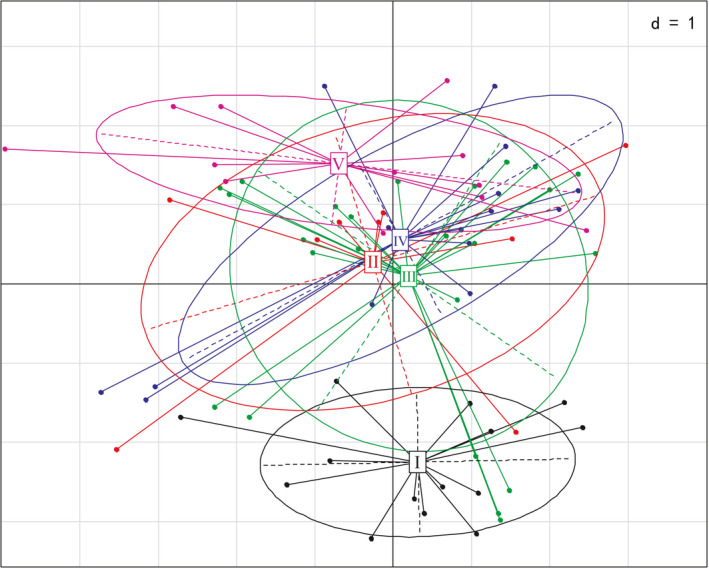
The variation of environmental variables composition among groups based on principal component analyses (PCA). The environmental variables of single groups are represented by ellipses

The variation of environmental variables composition among groups based on principal component analyses (PCA). The environmental variables of single groups are represented by ellipses