
FIGURE 5.
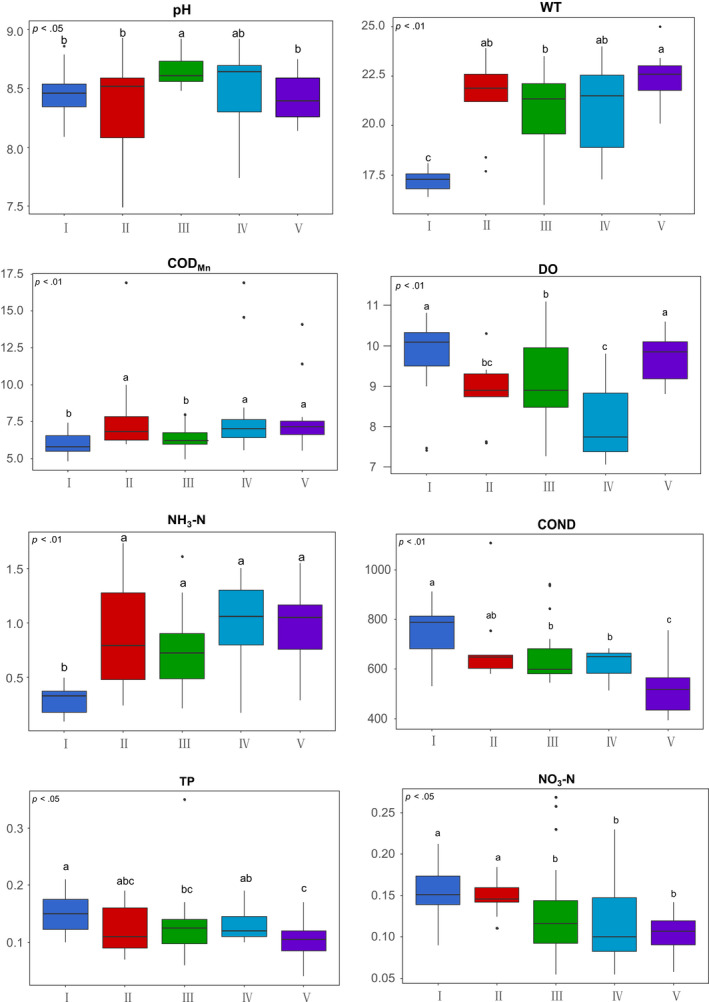
Kruskal–Wallis test boxplot of environmental variable based on self‐organizing map (SOM) grouping. Different letters indicate significant differences (p < .05). Environmental variable abbreviations are described in Section 2
Official websites use .gov
A
.gov website belongs to an official
government organization in the United States.
Secure .gov websites use HTTPS
A lock (
) or https:// means you've safely
connected to the .gov website. Share sensitive
information only on official, secure websites.
Kruskal–Wallis test boxplot of environmental variable based on self‐organizing map (SOM) grouping. Different letters indicate significant differences (p < .05). Environmental variable abbreviations are described in Section 2