Figure 2.

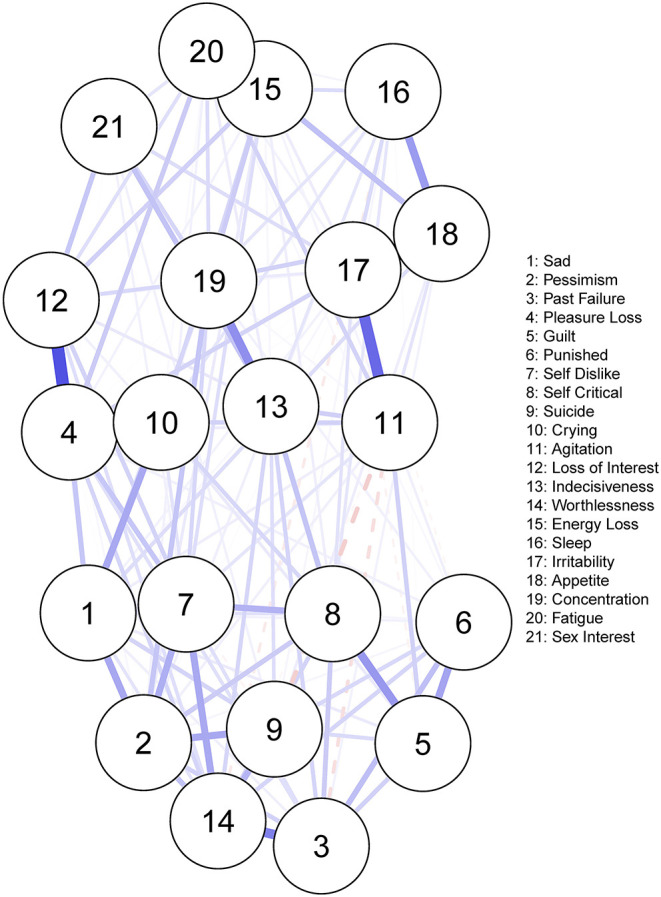
Residual symptom network post-CBT, measured using the BDI-II. Blue edges indicate symptom activation, and red edges indicate symptom inhibition.

Residual symptom network post-CBT, measured using the BDI-II. Blue edges indicate symptom activation, and red edges indicate symptom inhibition.