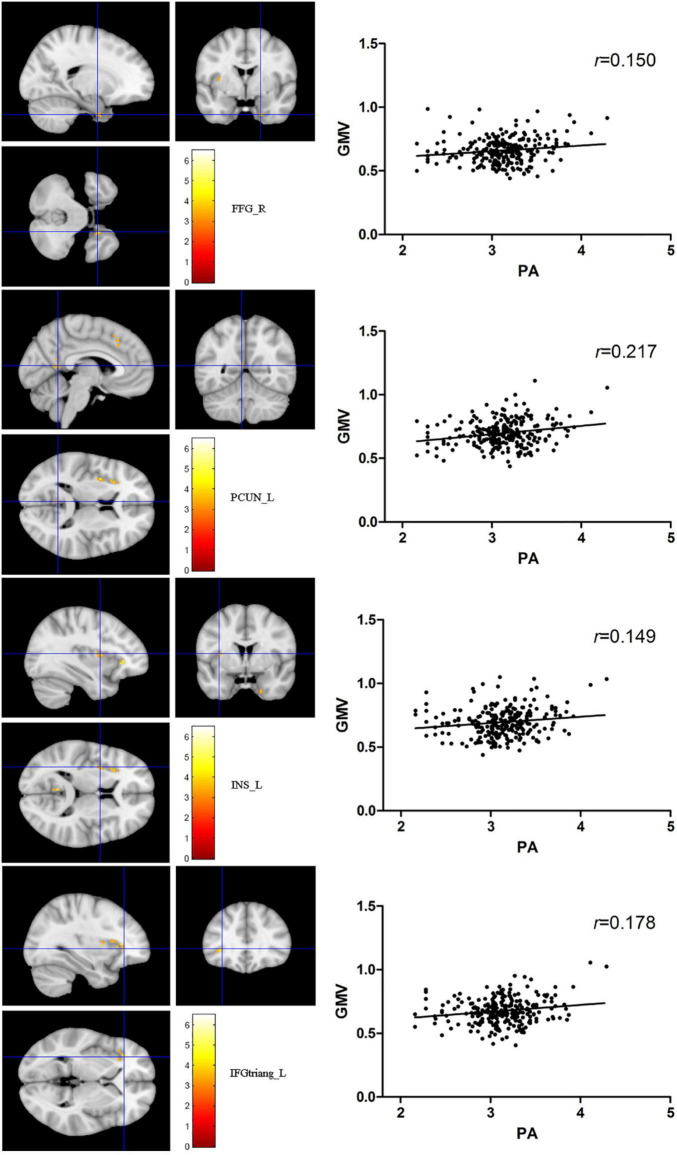
FIGURE 2.
The red-yellow color indicates positive association between total PA MET and gray matter volume (GMV) in the right fusiform gyrus, left precuneus, the left insula (INS), and left triangular part of inferior frontal gyrus. The color scale represents t values. The threshold for displaying was set to p < 0.05, family-wise error corrected.

