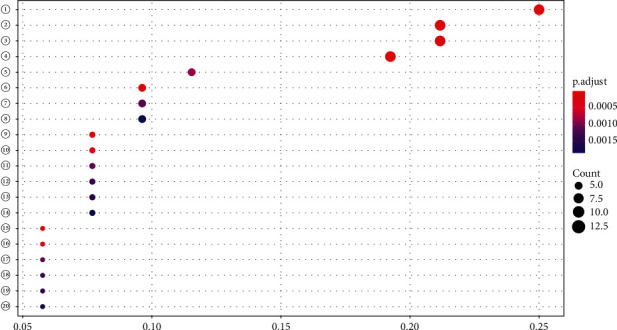
Figure 6.

GO analysis bubble chart. The node size represents the number of enrichment targets; the color of the node from red to dark blue indicates that the P value is small to large, so the larger the red node, the more significant the signaling pathway, indicating that the signaling pathway is more important. (1) DNA-binding transcription factor binding; (2) RNA polymerase II-specific DNA-binding transcription factor binding; (3) ubiquitin-like protein ligase binding; (4) ubiquitin protein ligase binding; (5) kinase regulator activity; (6) activating transcription factor binding; (7) nuclear hormone receptor binding; (8) hormone receptor binding; (9) cysteine-type endopeptidase activity involved in the apoptotic process; (10) estrogen receptor binding; (11) p53 binding; (12) repressing transcription factor binding; (13) steroid hormone receptor binding; (14) ATPase binding; (15) cysteine-type endopeptidase activity involved in the apoptotic signaling pathway; (16) histone kinase activity; (17) aromatase activity; (18) transcription coactivator binding; (19) NF-kappaB binding; (20) oxidoreductase activity.
