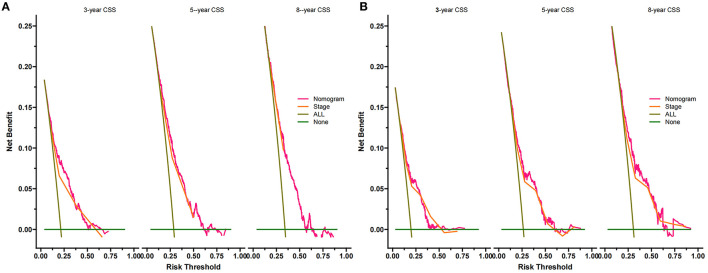
Figure 5.
Decision curves of the nomogram predicting CSS in the training set (A) and the validation set (B). The x-axis is the threshold probability, and the y-axis is the net benefit. The green line indicates that no patients have died, and the dark green line indicates that all patients have died. When the threshold probability is between 10 and 50%, the net benefit of the model exceeds all deaths or no deaths.

