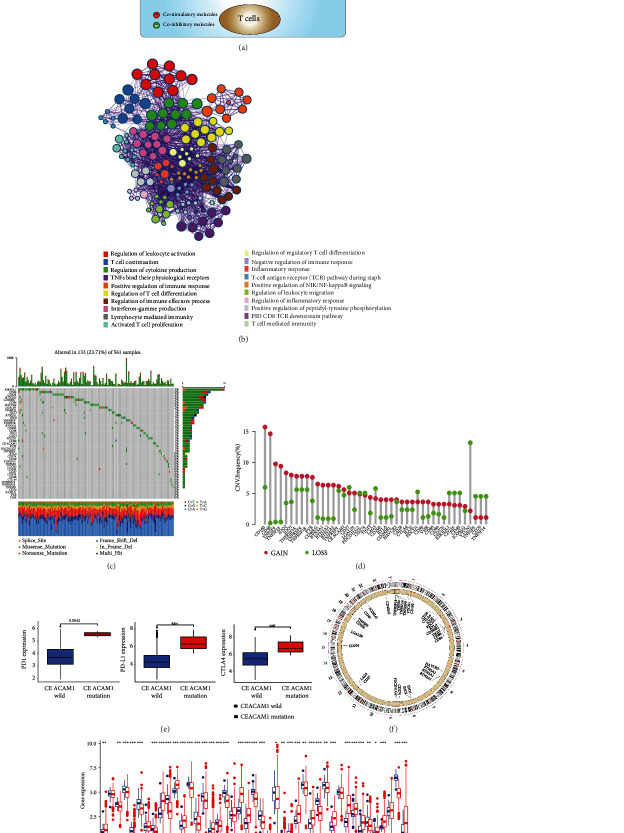
Figure 1.
The landscape of genetic and expression alterations of immune checkpoint genes in lung adenocarcinoma. (a) A brief description of the representative immune checkpoint molecules involved in the antitumor immunity. Mechanisms of costimulatory and coinhibitory interactions among tumor cells, T cells, and APC in the tumor microenvironment. (b) Metascape GO analysis of 43 ICGs showed the significant biological process enriched terms. Different colours correspond to indicated enrichment terms. (c) The mutation frequency of 43 ICGs in TCGA-LUAD cohort. Each column represented an individual sample. The number on the right indicated the mutation frequency for each gene. The right histogram summarized the percentage of each variant type. The stacked barplot below indicated fraction of conversions, and the upper barplot showed TMB for an individual sample. (d) The CNV variation frequency of ICGs in TCGA-LUAD cohort. The vertical axis represented the alteration frequency. The deletion frequency, green dot; the amplification frequency, red dot. (e) The effects of CEACAM1 mutation status on PD-L1, PD-1, and CTLA-4 expression. All gene expression values are expressed as TPM. (f) The location of CNV alteration of representative ICGs on chromosomes. (g) The mRNA expression of 43 m6A regulators between normal tissues and lung adenocarcinoma tissues. All gene expression values are expressed as TPM. Normal, blue; tumor, red (∗P < 0.05; ∗∗P < 0.01; ∗∗∗P < 0.001).

