
Figure 2.
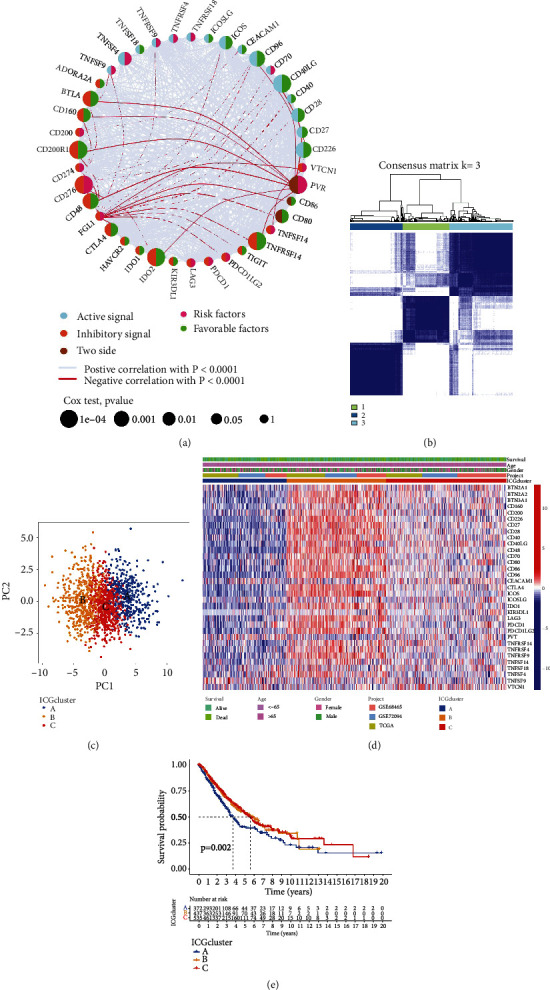
Identification of distinct ICG expression subtypes in LUAD. (a) The interactions of ICGs in LUAD. Active signal, light blue; inhibitory signal, orange; two-side signal, brown. Pink semicircle represented the risk factors of prognosis; green semicircle represented the protective factors of prognosis. The size of the circle represented the effect of ICGs on the prognosis, and the statistical significance was calculated by the Log-rank test. The lines among different ICGs indicated their interactions, and negative correlation was marked with bright red and positive correlation with gray. (b) Consensus clustering matrix for k = 3 based on ICG expression. (c) Principal component analysis of ICG expression to distinguish different ICG subtypes. (d) Unsupervised clustering of ICG expression to classify patients into three ICG subtypes. The ICG clusters, datasets, gender, age, and survival status were used as patient annotations. (e) Kaplan-Meier curves of OS for three LUAD subtypes from TCGA-LUAD, GSE72094, and GSE68465. The numbers of patients in ICG-A, ICG-B, and ICG-C subtypes are 372, 437, and 535, respectively.