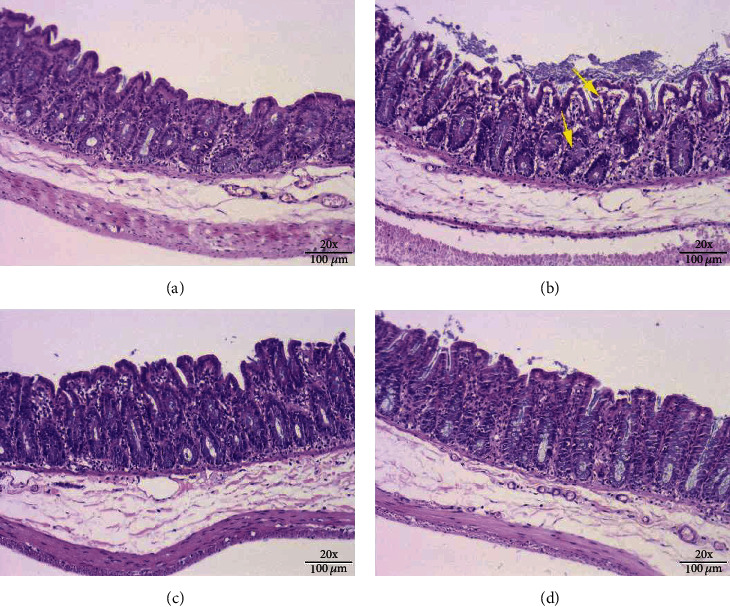
Figure 2.

H&E stained images showing the structures of the ceca of rats from the different experimental groups: (a) control group, (b) LPS group, (c) HBC group, and (d) LBC group (×200 magnification). The yellow arrow indicates the pathological damage in the cecum, such as the destruction or rupture of the intestinal gland structure.
