
Figure 5.
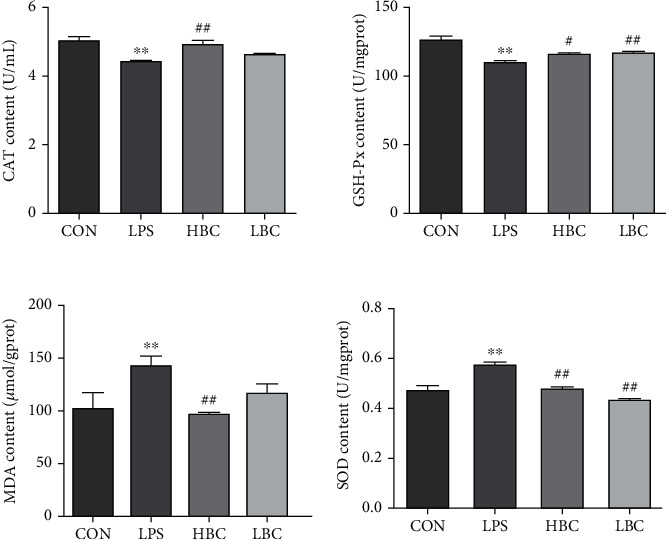
MDA: malondialdehyde; CAT, catalase; SOD: superoxide dismutase; GSH-Px: glutathione peroxidase; levels measured in the cecal tissues of the rats (CON: blank control group; LPS: LPS toxin group; HBC: high dose of B. coagulans + LPS group; LBC: low dose of B. coagulans + LPS group). The symbol “∗” indicates a significantly different result compared to the control group (p < 0.05) and “∗∗” a highly significant difference (p < 0.01). Similarly, “#” represents a significantly different result compared to the LPS group (p < 0.05) and “##” a highly significant difference (p < 0.01).