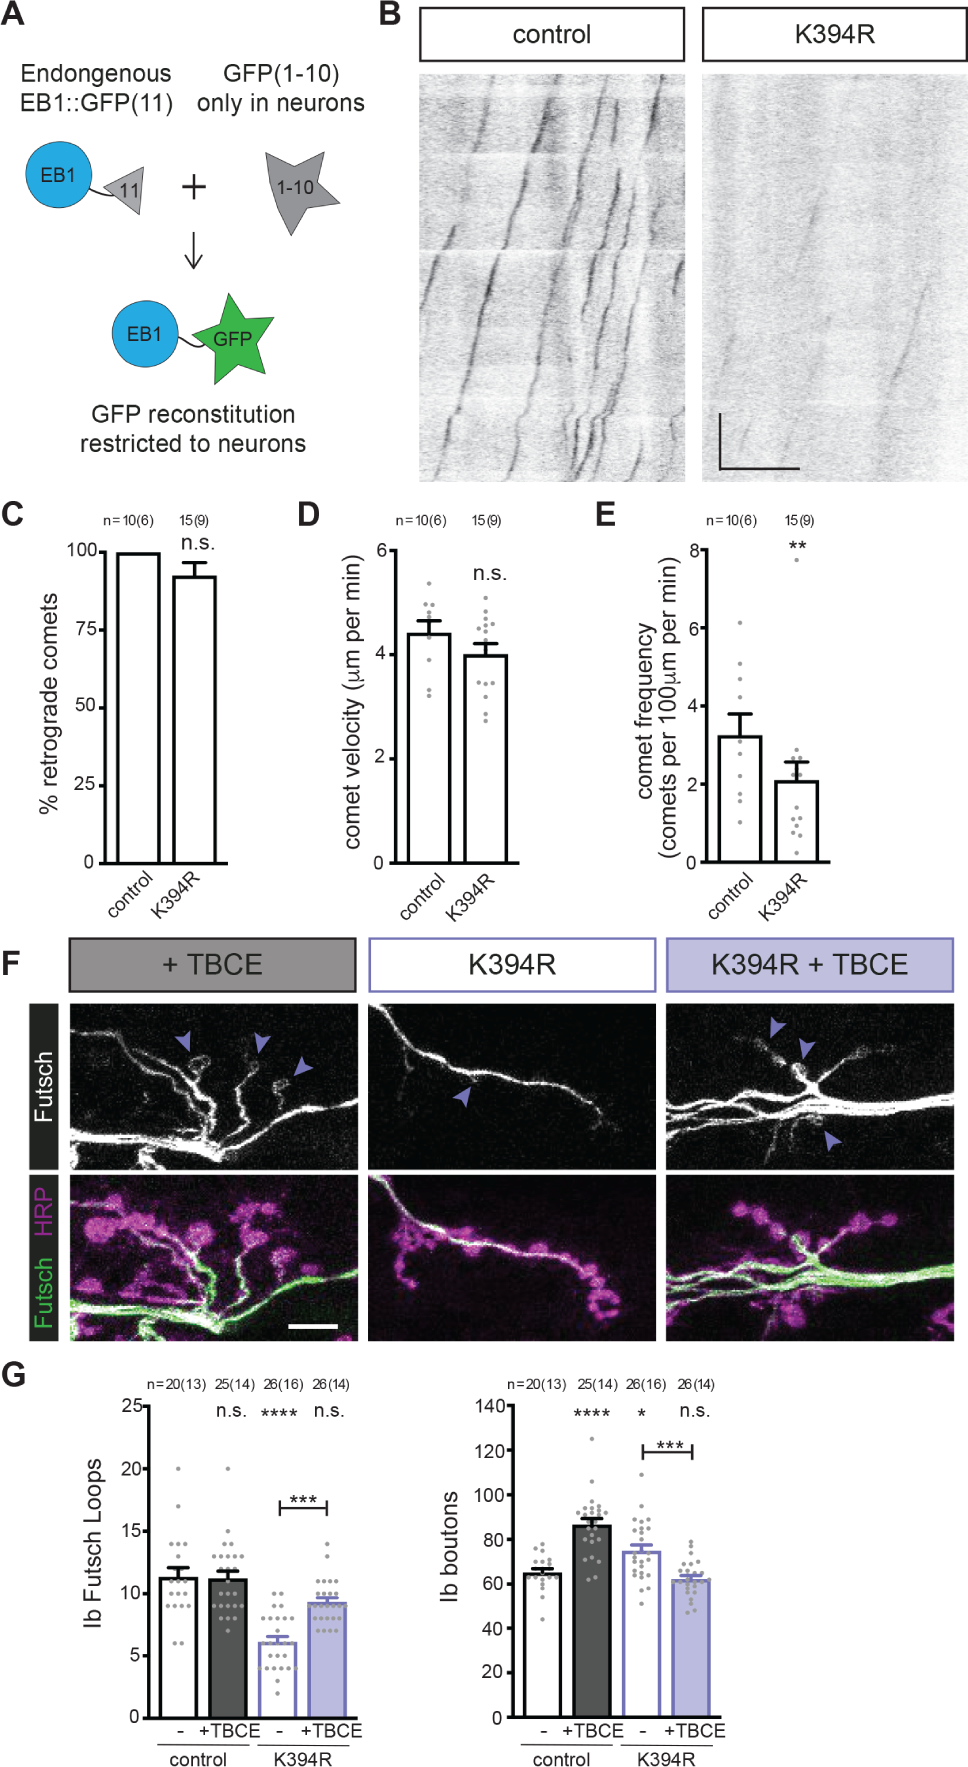
Figure 5. Elevating tubulin chaperone levels reverts K394R mutant phenotypes.

All genotypes are homozygous for wild-type or mutant αTub84B alleles.
(A) Cartoon showing the approach to visualise EB1::sfGFP specifically in neurons. Endogenous EB1 was tagged with the split-GFP peptide sfGFP(11), and pickpocket-Gal4 drove the expression of sfGFP(1–10) in sensory neurons to limit the reconstitution of sfGFP to neurons. (B) Representative kymographs of endogenous EB1 dynamics in control and K394R sensory neuron dendrites. Cell body is to the left. One copy each of EB1::sfGFP(11), pickpocket-Gal4, and UAS-sfGFP(1–10) were used. Scale bars: 10 μm (x-axis) and 30 seconds (y-axis). (C-E) Quantification of EB1::GFP comet trajectory (C), velocity (D), and frequency (E) in control and K394R mutants. p-values: p=0.16, control v. K394R (C); p=0.19, control v. K394R (D); p=0.0083, control v. K394R (E).
(F and G) Representative (F) images and quantification (G) of Futsch loops and type Ib boutons in controls and animals over-expressing TBCE, K394R mutants, and K394R mutants over-expressing TBCE. One copy each of OK6-Gal4 and UAS-TBCE were used to over-express TBCE. Larval fillets are stained for stable microtubules (Futsch) and a neuronal membrane marker (HRP). Arrowheads: Futsch loops. Scale bar: 10 μm. p-values, Ib Futsch loops: p=1.0, control v. +TBCE; p<0.000001, control v. K394R; p=0.057, control v. K394R +TBCE; p=0.00013, K394R v. K394R +TBCE (G, left). p-values, Ib boutons: p<0.000001, control v. +TBCE; p=0.024, control v. K394R; p=0.89, control v. K394R +TBCE; p=0.00045, K394R v. K394R +TBCE (G, right).
Quantification: Student’s unpaired t-test (C-E) and one-way ANOVA with post-hoc Tukey (G). All data are mean ± SEM. n.s=non-significant; *p=0.01–0.05, **p=0.01–0.001, ***p=0.001–0.0001, ****p<0.0001.
