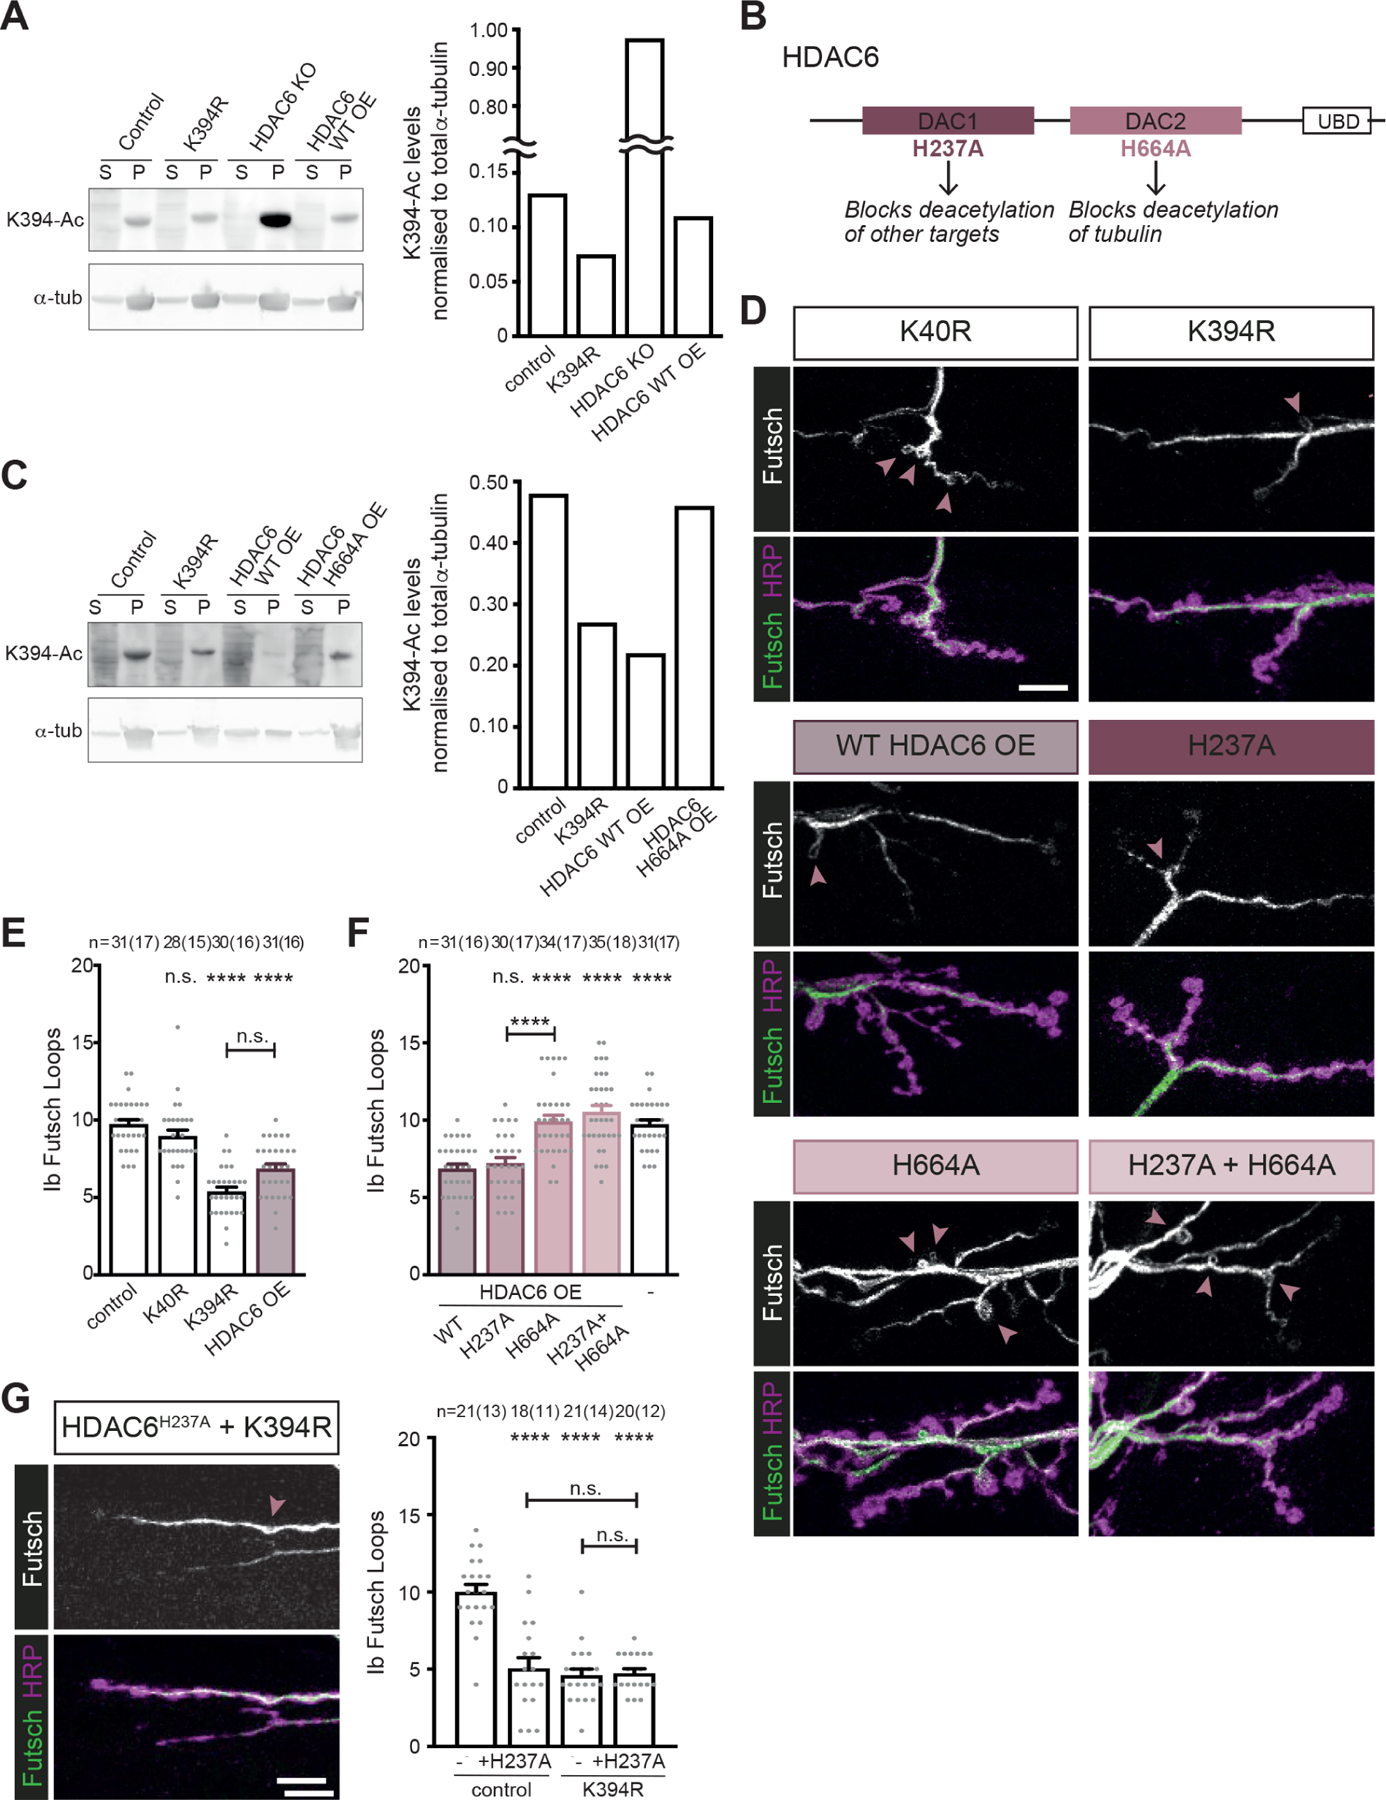
Figure 6. α-tubulin K394 acetylation is regulated by HDAC6.

All genotypes are homozygous for wild-type or mutant αTub84B alleles and an HDAC6 knockout (KO) allele. elav-Gal4 (A and C) or OK6-Gal4 (D-G) were used to drive one copy of UAS-HDAC6 (wild-type or mutant as indicated). Larval fillets are stained for stable microtubules (Futsch) and a neuronal membrane marker (HRP) (D and G).
(A) Western blot analysis (left) and quantification (right) of K394 acetylation of microtubules pelleted from control, K394R, and HDAC6 KO, and HDAC6 over-expression (OE) fly heads. The anti-Ac-K394 signal in the tubulin pellet lane is normalised to total α-tubulin. S=supernatant, P=pellet. See also Figure S3 for analysis of K394 acetylation in control, K394R and dαTAT over-expression fly heads.
(B) Cartoon illustrating HDAC6 and its key domains, including two deacetylase domains (DAC1 and DAC2) and a ubiquitin-binding domain (UBD). The functional outcomes of point mutations in DAC1 and DAC2 are indicated.
(C) Western blot analysis (left) and quantification (right) of K394 acetylation of microtubules pelleted from control and K394R fly heads and the heads of flies over-expressing wild-type HDAC6 (WT OE) or mutant HDAC6 (H664A OE). The anti-Ac-K394 signal in the tubulin pellet lane is normalised to total α-tubulin. S=supernatant, P=pellet.
(D-F) The activity of DAC2 is necessary to reduce microtubule stability similar to the K394R mutants. Representative images (D) and quantification (E and F) of Futsch loops and type Ib boutons in control, K40R and K394R mutants, and animals over-expressing wild-type HDAC6 (HDAC6 OE) or mutant HDAC6 (H237A and/or H664A). All genotypes were included in the experiment, whose quantification is split between panels E and F. The quantification of the control and animals over-expressing wild-type HDAC6 are included in both E and F. p-values: p=0.74, control v. K40R; p<0.000001, control v. K394R; p<0.000001, control v. HDAC6 WT OE; p=0.062, K394R v. HDAC6 WT OE (E). p-values: p=0.99, HDAC6 WT OE v. HDAC6 H237A OE; p<0.000001, HDAC6 WT OE v. HDAC6 H664A OE; p<0.000001, HDAC6 WT OE v. HDAC6 H237A H664A OE; p<0.000001, HDAC6 WT OE v. control; p=0.000003, HDAC6 H237A OE v. HDAC6 H664A OE (F).
(G) Representative image (left) and quantification (right) of HDAC6 H237A overexpression in the K394R mutant. p-values: p<0.000001, control v. +HDAC6 H237A OE; p<0.000001, control v. K394R; p<0.000001, control v. K394R +HDAC6 H237A OE; p=0.997, K394R v. K394R +HDAC6 H237A OE; p=0.971, +HDAC6 H237A OE v. K394R +HDAC6 H237A OE.
Arrowheads: Futsch loops. Scale bar: 10 μm.
Quantification: One-way ANOVA with post-hoc Tukey. All data are mean ± SEM. n.s=non-significant; *p=0.01–0.05; ***p<0.0001.
