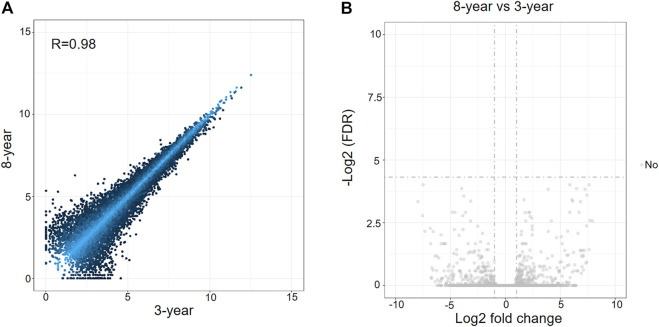
FIGURE 1.
Analysis of differentially expressed mRNAs between 3-years group and 8-years group. (A) Scatterplot of mRNA expression variation between the two groups. The normalized expression values of each gene are shown on the x-axis and the y-axis. (B) Volcano plots of mRNA expression variation between the two groups. Gray dots represent non-differentially expressed genes between the two groups.

