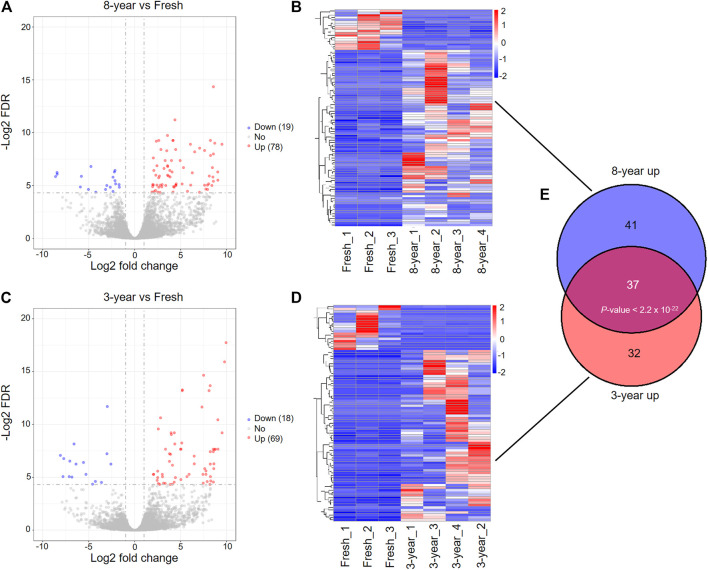
FIGURE 2.
Differentially expressed mRNAs between fresh embryos and vitrified-warmed embryos with different storage times. (A) Volcano plots of the DEmRNAs between the 8-years group and fresh group. Red and blue dots represent upregulated and downregulated genes in the 8-years group. Gray dots represent non-differentially expressed genes. (B) Heatmap showing the expression profile of DEmRNAs between the 8-years group and fresh group. (C) Volcano plots of the DEmRNAs between 3-years group and fresh group. (D) Heatmap showing the expression profile of DEmRNAs between the 3-years group and fresh group. (E) Statistically significant overlap between the upregulated mRNA lists from (B,D) determined by Fisher’s exact test (p < 2.2 × 10⁻²²).

