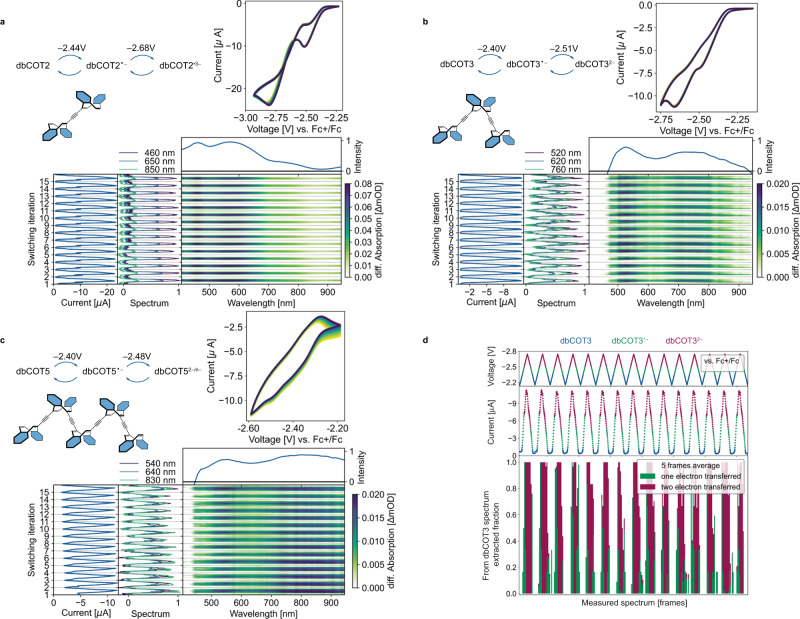
Fig. 5. Spectroelectrochemical characterization of dbCOT2, dbCOT3, and dbCOT5.
a–c Peak potentials (Ep) were recorded in separate CV experiments. Voltammograms were recorded during in situ spectroelectrochemistry measurements (15 cycles shown). Differences in peak potential reflect increased resistance due to the working electrode’s proximity to the vessel wall in spectroelectrochemistry experiments. UV–VIS spectra were recorded in reflective mode using an incandescent lamp as the light source (400–1000 nm). The heatmap shows the differential spectra relative to the ground state spectrum. The spectral trace around the maximum difference is shown above each heatmap. Spectral slices at selected wavelengths and the corresponding measured electric current during the CV are shown in the middle and left panel, respectively. Electrochemistry conditions: solvent = THF; supporting electrolyte = Bu4NPF6; working electrode = polished gold disc; reference electrode = silver wire pseudo-electrode. Potentials are referenced to that of ferrocene (Fc). d Optical deconvolution of dbCOT3, dbCOT3•−, and dbCOT32− during electrochemical cycling of dbCOT3. Lower panel: factorial deconvolution of the spectra in (b) using two species-associated spectra. Middle and top panel: measured current and applied voltage, arbitrarily colored to guide the eye with respect to state.

