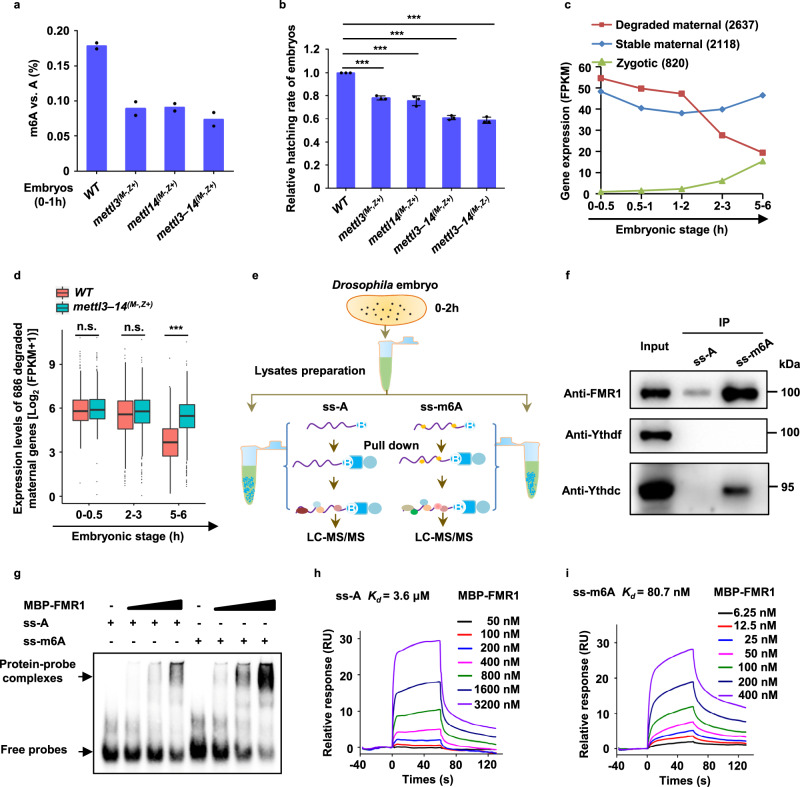
Fig. 1. The m6A modification regulates maternal RNA decay via preferentially binding m6A-marked mRNAs.
a Abundances of m6A on mRNAs from indicated embryos were measured by mass spectrometry. The mole ratios of m6A vs. A are shown on the y-axis. Data expressed as means of two independent samples. b Relative hatching rate of embryos with indicated genotypes (mettl3(M−,Z+), P = 2.5e−05; mettl14(M−,Z+), P = 0.0005; mettl3–14(M−,Z+), P = 4.6e−06; mettl3–14(M−,Z−), P = 1.6e−05). Data expressed as means of three independent experiments. The two-sided Student’s t test was used to analyze statistical variance. Error bars indicate mean ± SD. ***P < 0.001. c Expression profile of clustered gene groups by RNA sequencing. d The degraded maternal mRNAs (686 overlapped mRNAs shown in Fig. S1h) in mettl3–mettl14 double maternal mutant embryos displayed aberrant stable, when compared to wild-type at the 5–6-h stage (0–0.5 h, P = 0.33; 2–3 h, P = 0.48; 5–6 h, P = 3e−35). P-values were calculated by a one-sided Student’s t test. The boxplot shows median (the horizontal line in the box), 1st and 3rd quartiles (lower and upper bounds of box, respectively), minimum and maximum (lower and upper whiskers, respectively). e Schematic for RNA pulldown and proteomics analysis. f Western blot assays were performed by using the anti-Drosophila FMR1, anti-Ythdf, and anti-Ythdc antibodies against complexes purified by the m6A modified or unmodified RNA probes. Representative figures of three independent replicates are shown. g EMSAs showing the complex formation of FMR1 with m6A modified or unmodified probes. Representative figures of three independent replicates are shown. h, i Surface plasmon resonance (SPR) assays of the interaction of FMR1 protein with unmodified probe (h) or with m6A-modified probe (i). Equilibrium and kinetic constants were calculated by a global fit to the 1:1 Langmuir binding model. RU resonance units. Source data are provided as a Source Data file and Supplementary Data 1 and 2.

