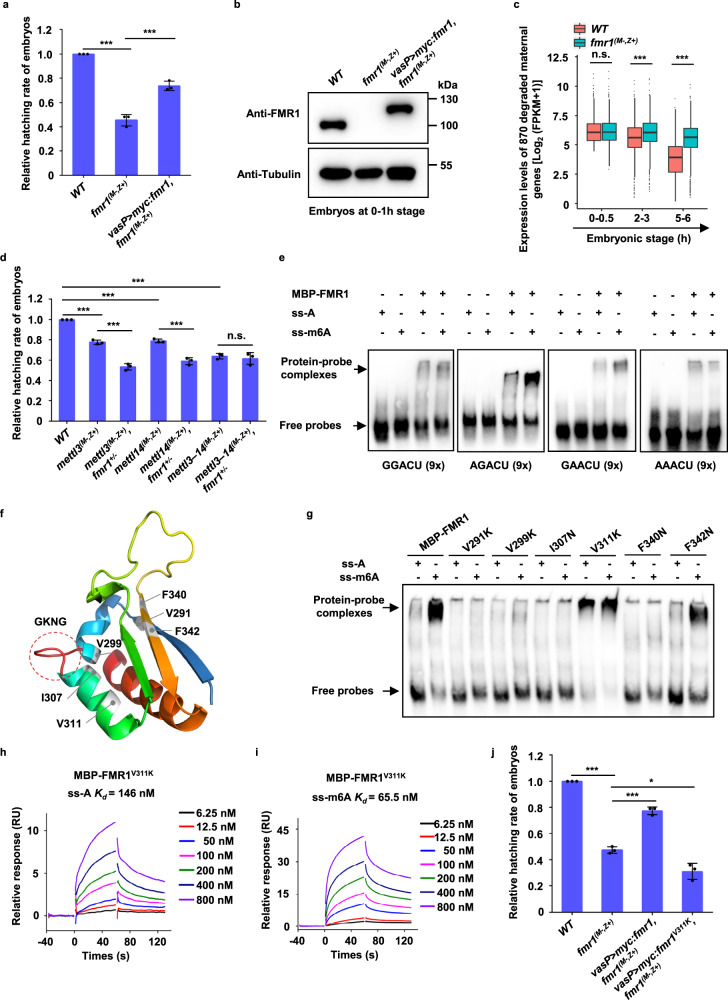
Fig. 2. FMR1 preferentially binds RNAs with the m6A marked “AGACU” motif in a residue-dependent manner.
a Relative hatching rate of embryos with indicated genotypes (WT vs. fmr1(M−,Z+), P = 2.6e−05; fmr1(M−,Z+) vs. vasP > myc:fmr1, fmr1(M−,Z+), P = 0.0008). b Western blot assays were performed to show expression levels of endogenous FMR1 or overexpressed Myc-FMR1 in the 0–1-h embryos with indicated genotypes. The experiment was performed once. c The degraded maternal mRNAs (870 overlapped mRNAs shown in Fig. S4c) in fmr1 maternal mutant embryos displayed aberrant stable, when compared to wild-type at the 5–6-h stage (0–0.5 h, P = 0.49; 2–3 h, P = 5.5e−05; 5–6 h, P = 3.4e−48). P-values were calculated by a one-sided Student’s t test. The boxplot shows median (the horizontal line in the box), 1st and 3rd quartiles (lower and upper bounds of box, respectively), minimum and maximum (lower and upper whiskers, respectively). d Relative hatching rate of embryos with indicated genotypes (WT vs. mettl3(M−,Z+), P = 4.9e−05; WT vs. mettl14(M−,Z+), P = 3e−05; WT vs. mettl3−14(M−,Z+), P = 1.9e−05; mettl3(M−,Z+) vs. mettl3(M−,Z+), fmr1+/−, P = 0.0003; mettl14(M−,Z+) vs. mettl14(M−,Z+), fmr1+/−, P = 0.00098; mettl3–14(M−,Z+) vs. mettl3–14(M−,Z+), fmr1+/−, P = 0.56). e EMSAs showing the binding capability of FMR1 to RNA probes containing either “GGACU”, “AGACU”, “GAACU”, or “AAACU” sequences (9×) with or without m6A modification. Representative figures of three independent replicates are shown. f Structure modeling showing a hydrophobic network within the KH2 domain of FMR1. g EMSAs were performed to detect the binding affinities of FMR1 proteins carrying indicated site mutation to RNA probes with or without m6A modification. Representative figures of three independent replicates are shown. h, i SPR assays showing binding affinity of FMR1V311K protein with RNA probes with unmodified RNA probes (h) or with m6A-modified probes (i). Equilibrium and kinetic constants were calculated by a global fit to 1:1 Langmuir binding model. RU resonance units. j Relative hatching rate of embryos with indicated genotypes (WT vs. fmr1(M−,Z+), P = 3.5e−06; fmr1(M−,Z+) vs. vasP > myc:fmr1, fmr1(M−,Z+), P = 0.0002; fmr1(M−,Z+) vs. vasP > myc:fmr1V311K, fmr1(M−,Z+), P = 0.014). In a, d, j, data were expressed as means of three independent experiments, and the two-sided Student’s t test was used to analyze statistical variance. Error bars indicate mean ± SD. *P < 0.05, ***P < 0.001. n.s. not significant. Source data are provided as a Source Data file and Supplementary Data 2.

