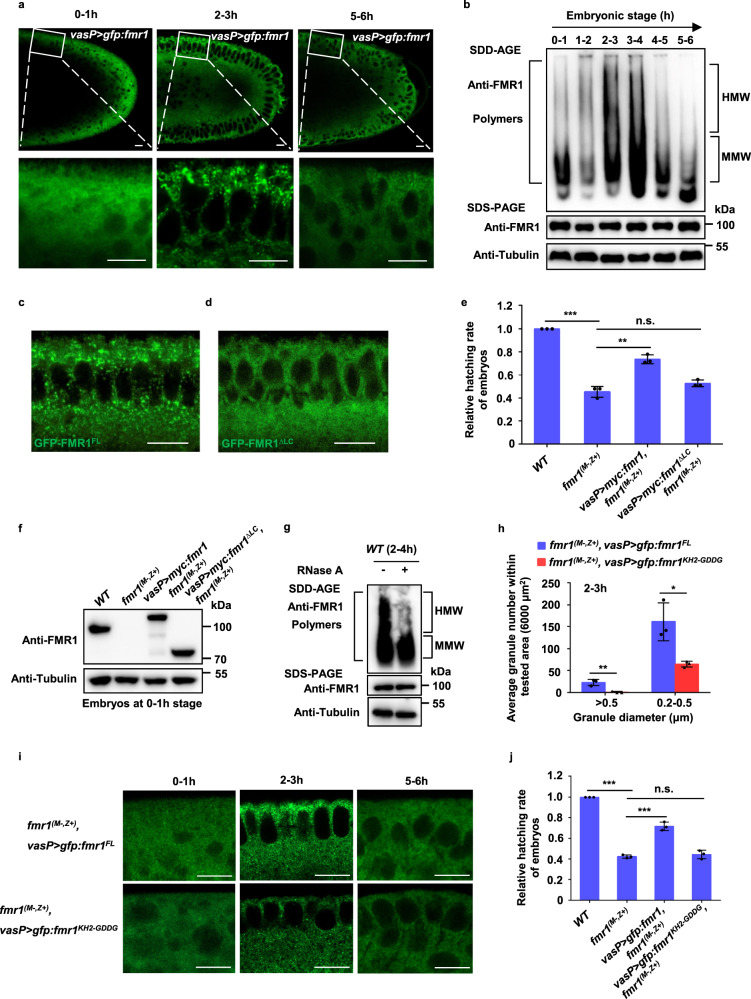
Fig. 3. FMR1 granules undergo a dynamical assembly in early embryos in an LC domain- and RNA binding-dependent manner.
a Confocal imaging of live embryos with maternally expressing GFP-FMR1FL in wild-type embryos at the 0–1, 2–3, and 5–6-h stages. Representative figures of five independent replicates are shown. Scale bars, 10 μm. b Crude extracts of wide-type embryos were prepared from the indicated time points, and aliquots of the extracts were then subjected to SDD-AGE and SDS-PAGE assays. Representative figures of three independent replicates are shown. HMW high-molecular-weight, MMW middle-molecular weight. c, d Confocal imaging of early embryos (at the 2–3-h stage) with maternally expressing GFP-FMR1FL (c) or GFP-FMR1ΔLC (d). Representative figures of three independent replicates are shown. Scale bars, 10 μm. e Relative hatching rate of embryos with indicated genotypes (WT vs. fmr1(M−,Z+), P = 3.3e−05; fmr1(M−,Z+) vs. vasP > myc:fmr1, fmr1(M−,Z+), P = 0.0012; fmr1(M−,Z+) vs. vasP > myc:fmr1∆LC, fmr1(M−,Z+), P = 0.08). f Western blot assays were performed to show expression levels of endogenous FMR1, overexpressed Myc-FMR1 or Myc-FMR1ΔLC in the 0–1-h embryos with indicated genotypes. The experiment was performed once. g Crude extracts of wide-type embryos by treating with RNase A were prepared, and aliquots of the extracts were then subjected to SDD-AGE and SDS-PAGE assays. Representative figures of two independent replicates are shown. HMW high-molecular-weight, MMW middle-molecular weight. h Quantifying the average number of FMR1 granules with different sizes within tested area (6000 μm2) in (i) (>0.5, P = 0.0062; 0.2–0.5, P = 0.018). i Confocal imaging of live embryos with maternally expressing GFP-FMR1FL or GFP-FMR1KH2-GDDG in fmr1 maternal mutant embryos at the 0–1, 2–3, and 5–6-h stages. Scale bars, 10 μm. j Relative hatching rate of embryos with indicated genotypes (WT vs. fmr1(M−,Z+), P = 3.3e−07; fmr1(M−,Z+) vs. vasP > gfp:fmr1, fmr1(M−,Z+), P = 0.0003; fmr1(M−,Z+) vs. vasP > gfp:fmr1KH2-GDDG, fmr1(M−,Z+), P = 0.47). In e, h, j, data were expressed as means of three independent experiments, and the two-sided Student’s t test was used to analyze statistical variance. Error bars indicate mean ± SD. *P < 0.05, **P < 0.01, ***P < 0.001. n.s. not significant. Source data are provided as a Source Data file.

