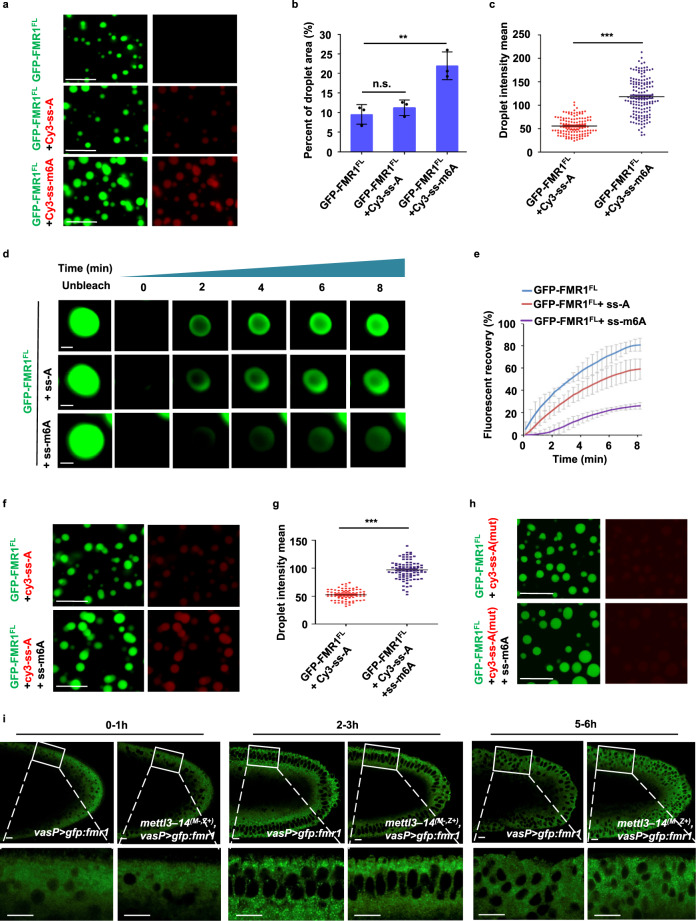
Fig. 4. The m6A modification regulates assembly/disassembly switch of FMR1 granules.
a Droplet formation assays for GFP-FMR1FL(10 µM) mixed with Cy3-labeled m6A-modified or unmodified probes, or alone. Scale bars, 10 μm. b The quantitative area of green droplet signal in (a) (GFP-FMR1FL + Cy3-ss-A, P = 0.41; GFP-FMR1FL + Cy3-ss-m6A, P = 0.008). c Quantitative intensity of RNA probes (red) droplet signal in (a) (P = 1.7e−40). d Fluorescence recovery after photo-bleaching (FRAP) assays to study the in vitro behavior of FMR1 droplets. Representative figures of four independent replicates are shown. Scale bars, 1 μm. e Changes in the fluorescence intensity of droplets after photobleaching were plotted over time. The curve represents the mean of the fluorescence intensity in the photobleached region of interest in distinct droplets (n = 4). Error bars indicate mean ± SD. f Droplet formation assays for the ability of GFP-FMR1FL(10 µM) to sequester unmodified RNAs (Cy3-labeled) with m6A-modified RNA probes or alone. Scale bars, 10 μm. g Quantitative intensity of RNA probes (red) droplet signal in (f) (P = 4.4e−51). h Droplet formation assays for testing the ability of GFP-FMR1FL (10 µM) to sequester unmodified mutant RNAs (Cy3-labeled) with m6A-modified RNA probes or alone. Representative figures of three independent replicates are shown. Scale bars, 10 μm. i Confocal imaging of live embryos with maternally expressing GFP-FMR1FL in wild-type or mettl3-mettl14 double maternal mutant embryos at the 0–1, 2–3, and 5–6-h stages. Representative figures of three independent replicates are shown. Scale bars, 10 μm. In b, c, g, data were expressed as means of three independent experiments, and the two-sided Student’s t test was used to analyze statistical variance. Error bars indicate mean ± SD (b) or SEM (c, g). **P < 0.01, ***P < 0.001. n.s. not significant. Source data are provided as a Source Data file.

