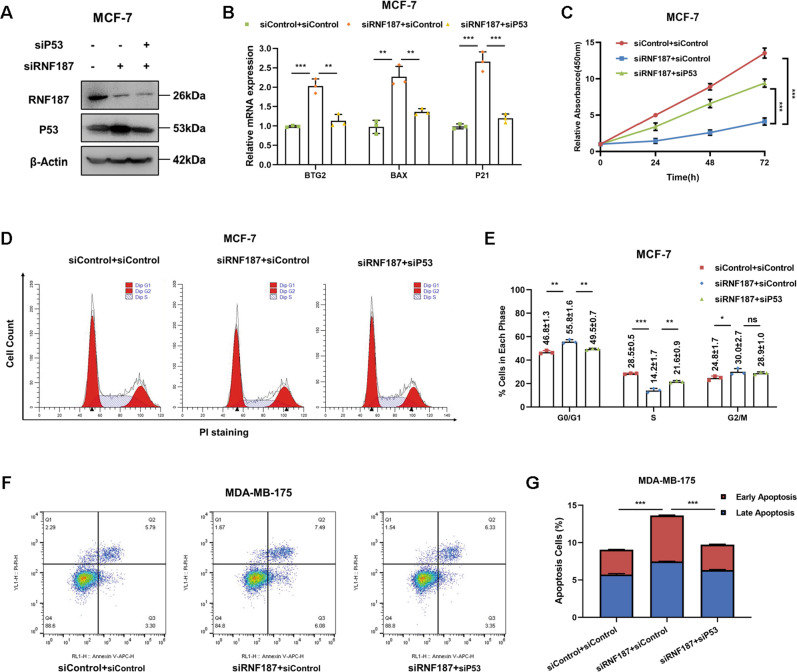
Fig. 4. RNF187 modulates cell growth and apoptosis via P53 signaling.
A RNF187 and P53 depletion effect in MCF-7 cells. MCF-7 cells were transfected with siControl, siRNF187, or siRNF187+siP53. After 48 h, the cells were harvested for western blot analysis. RNF187 and P53 protein levels were determined by western blot analysis. Actin was used as the internal control. B P53 depletion rescued the expression of its target genes inhibited by RNF187 knockdown. MCF-7 cells were transfected with siControl, siRNF187, or siRNF187+siP53. After 48 h, total RNA was extracted for gene expression analysis. Each group was analyzed in triplicate. *P < 0.05; **P < 0.01; ***P < 0.001 for target gene expression comparison. C Cell growth inhibition induced by RNF187 silencing was partially rescued by P53 depletion in MCF-7 cells. MCF-7 cells were transfected with 50 nM RNF187 siRNA, 50 nM control siRNA, or 50 nM siRNF187+siP53. After 24 h, a CCK-8 assay was used to determine the cellular metabolic activity at the indicated time points after transfection. Experiments were performed in triplicate. *P < 0.05; **P < 0.01; ***P < 0.001 for cell growth comparisons. D, E Cell cycle arrest caused by RNF187 silencing was partially rescued by P53 depletion in MCF-7 cells. MCF-7 cells were transfected with 50 nM RNF187 siRNA, 50 nM control siRNA, or 50 nM siRNF187+siP53. After 24 h, cells were harvested, fixed with 70% ethanol, and stained with propidium iodide. The cells were subjected to FACS analysis. Experiments were performed in triplicate. *P < 0.05; **P < 0.01; ***P < 0.001 for cell proportion comparisons. Representative histograms and cell cycle phase distributions are shown in Fig. 4D, E, respectively. F, G RNF187 depletion promoted apoptosis, and these effects were partially rescued by P53 depletion in MDA-MB-175 cells. MDA-MB-175 cells were transfected with 50 nM RNF187 siRNA, 50 nM control siRNA, or 50 nM siRNF187+siP53. After 24 h, cells were stained with PI and Annexin V. Then, cells were subjected to FACS analysis to determine the proportion of apoptotic cells. Each group was analyzed in triplicate. *P < 0.05; **P < 0.01; ***P < 0.001 for comparisons.

