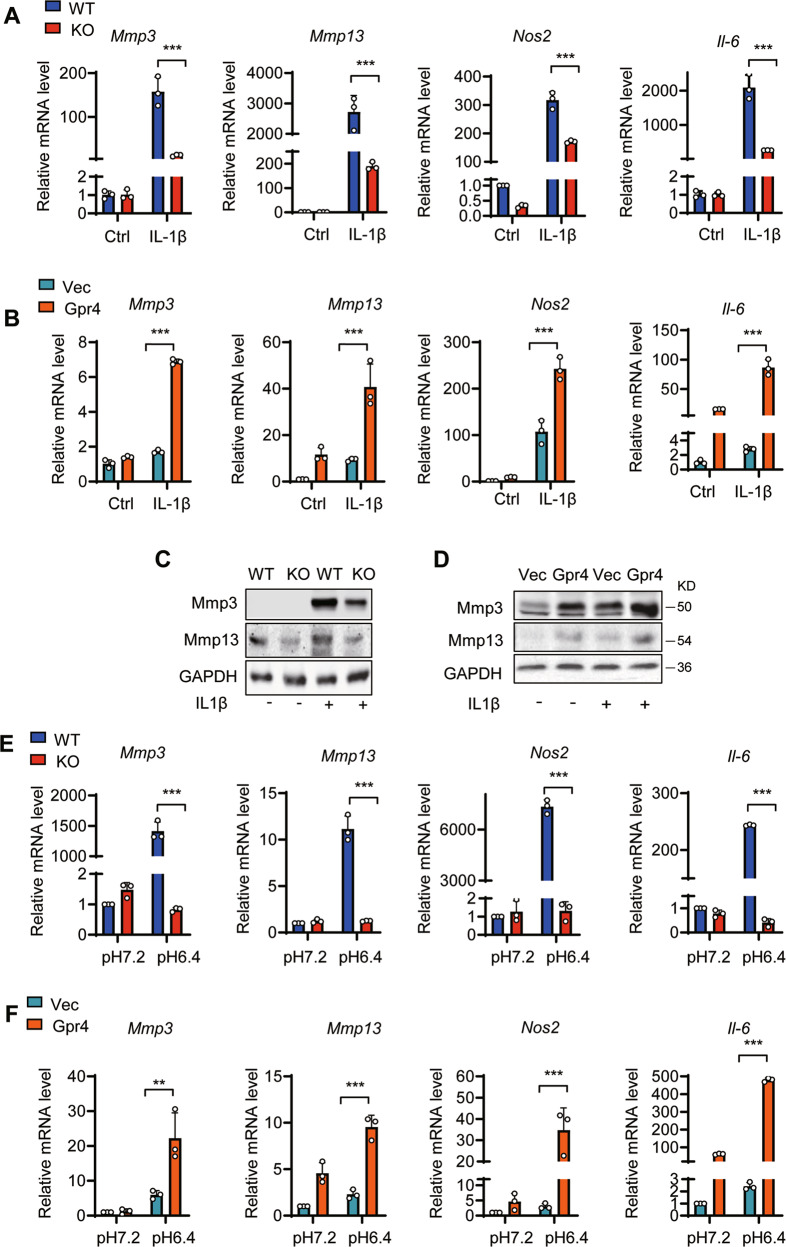
Fig. 6. GPR4 regulates cartilage matrix catabolism in mouse chondrocytes.
A The mRNA levels of Mmp3, Mmp13, Nos2, and Il-6 were quantified by qRT-PCR in primary chondrocytes from WT and Gpr4 knockout mice. The cells were stimulated with IL-1β (1 ng/ml) for 24 h. n = 3. All data are presented as mean ± s.d. ***p < 0.001, using two-way ANOVA followed by Tukey’s post hoc test. B The mRNA levels of Mmp3, Mmp13, Nos2, and Il-6 were quantified by qRT-PCR in ATDC5 cells from vector control (Vec) or Gpr4 transfected cells. Twenty-four hours after transfection, cells were stimulated with IL-1β (1 ng/ml) for another 24 h. n = 3. Data are expressed as mean ± s.d. ***p < 0.001, using two-way ANOVA followed by Tukey’s post hoc test. C, D Western blot analysis of Mmp3 and Mmp13 in chondrocytes of WT and Gpr4 knockout mice (C) or vector control (Vec) and Gpr4 transfected ATDC5 cells (D). The cells were treated with IL-1β (10 ng/ml) for 48 h prior to harvest. E, F The mRNA levels of Mmp3, Mmp13, Nos2, and Il-6 was determined in primary chondrocytes from WT and Gpr4 knockout mice (E) or in ATDC5 cells with or without GPR4 transfection (F) cultured at the indicated pH value. n = 3. Data are expressed as mean ± s.d. **p < 0.01, ***p < 0.001, using two-way ANOVA followed by Tukey’s post hoc test.

