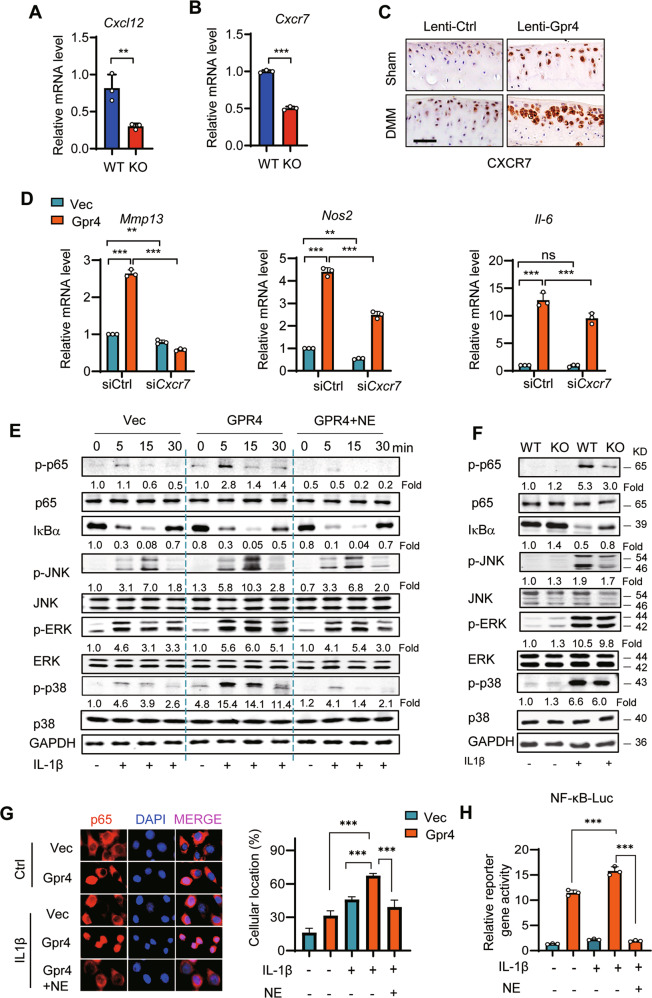
Fig. 7. GPR4 regulates cartilage matrix homeostasis through the CXCR7/CXCL12 signaling pathway.
A The mRNA expression of Cxcl12 in primary chondrocytes from WT or littermate Gpr4 KO mice. n = 3. Data are presented as mean ± s.d. **p < 0.01, using unpaired two-tailed Student’s t test. B The mRNA expression of Cxcr7 in primary chondrocytes from WT or littermate Gpr4 KO mice was evaluated. n = 3. Data are presented as mean ± s.d. ***p < 0.001, using unpaired two-tailed Student’s t test. C Representative images of IHC staining of CXCR7 in articular cartilage sections from Sham- or DMM-operated mice with Lenti-Gpr4 or Lenti-Ctrl infection (refer to Fig. 2B). Scale bars, 50 μm. D Cxcr7 knockdown reduced GPR4 overexpression-induced cartilage catabolic gene Mmp13, Nos2, and Il-6 upregulation. Vector control (Vec) or Gpr4 overexpressing ATDC5 cells were transfected with the control small interfering RNA (siCtrl) or siCxcr7 and exposed to IL-1β (1 ng/ml) for 24 h. Expression of mRNA was analyzed by qRT-PCR. n = 3. Data are presented as mean ± s.d. **p < 0.01, ***p < 0.001, ns, no significant difference using two-way ANOVA followed by Tukey’s post hoc test. E ATDC5 cells were transfected with vector control or Gpr4, and incubated with NE52-QQ57 (NE, 10 μM) for 24 h. Then the cells were stimulated with IL-1β (10 ng/ml) for indicated times. Whole-cell lysates were subjected to Western blot analysis to determine the total protein and phosphorylation levels of MAPKs, NF-κB (p65), and IκBα. F Chondrocytes from GPR4 KO mice and WT mice were stimulated with or without IL-1β (10 ng/ml) for 5 min. The protein and phosphorylation levels of MAPKs, NF-κB (p65), and IκBα were evaluated by Western blot. G Representative immunostaining images of p65 nuclear localization (left) and quantification of the percentage of cells with nuclear p65 (right). GPR4 overexpressing ATDC5 cells were treated with NE52-QQ57 (NE, 10 μM) or IL-1β (1 ng/ml) for 12 h, and then subjected to immunofluorescence staining. Data are presented as mean ± s.d. ***p < 0.001, one-way ANOVA followed by Bonferroni’s test was used for statistical analysis. H NF-κB reporter gene activity in GPR4 overexpressing ATDC5 cells treated with NE52-QQ57 (NE, 10 μM) or IL-1β (1 ng/ml) for 12 h. Data are presented as mean ± s.d. ***p < 0.001, one-way ANOVA followed by Bonferroni’s test was used for statistical analysis.

