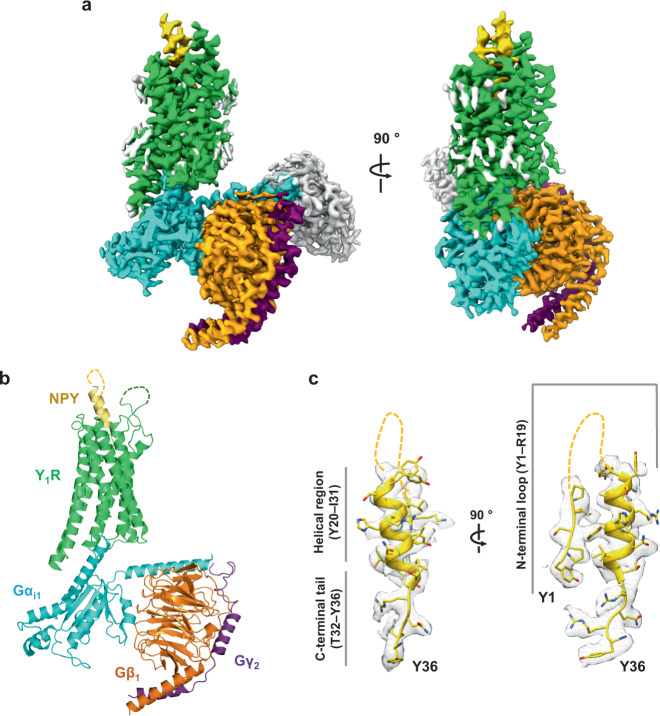
Fig. 1. Overall structure of the NPY–Y1R–Gi1–scFv16 complex.
a The cryo-EM map of the NPY–Y1R–Gi1–scFv16 complex is shown. Y1R, NPY, Gαi1, Gβ1, Gγ2, and scFv16 are colored green, yellow, cyan, orange, purple, and gray, respectively. The remaining micelle density is shown in light gray. Details on cryo-EM map generation are described in the “Methods” section. b The structure of the NPY–Y1R–Gi1 complex is shown. scFv16 is included in the final structure but omitted in this figure for clarity. c The sharpened cryo-EM map with the NPY peptide model is shown in two orientations. NPY residues 6–19 are not modeled in this structure and are shown as dashed lines. The three regions of NPY are marked as the N-terminal loop region (Y1–R19), the helical region (Y20–I31), and the C-terminal tail (T32–Y36).

