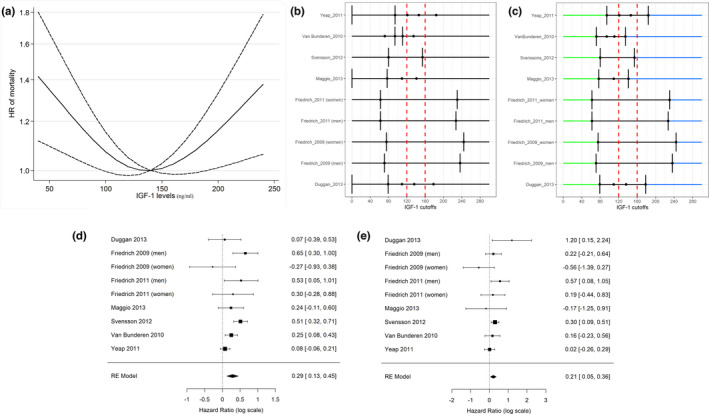
FIGURE 3.

(a) Dose–response association between IGF‐1 levels and risk of all‐cause mortality (P1 for nonlinearity = −0.0056, Coef1 = 0.001; P2 for nonlinearity < 0.001, Coef2 = 0.0105). Dashed lines indicate the 95% confidence intervals for the spline model. The horizontal dashed line corresponds to the reference (140 ng/ml) HR of 1.0. (b, c): IGF‐1 categories originally used to define high‐, low‐, and intermediate‐risk intervals in the nine selected studies (b). Vertical bars correspond to the adopted IGF‐1 cutoffs. (c) Reconfiguration of the IGF‐1 categories according to the proposed approach. Blue lines define high risk categories; green lines define low risk categories. The combined HR was obtained using the intermediate categories as a reference group (black lines). *For both Friedrich’ studies IGF‐1 cutoffs were computed as mean values of the groups identified according to the age‐ and sex‐specific 10th and 90th percentile. (d, e) Forest plot of pooled analysis for the low (d) and the high (e) categories of IGF‐1 compared to the middle category (hazard ratios reported in the log scale in both panels)
