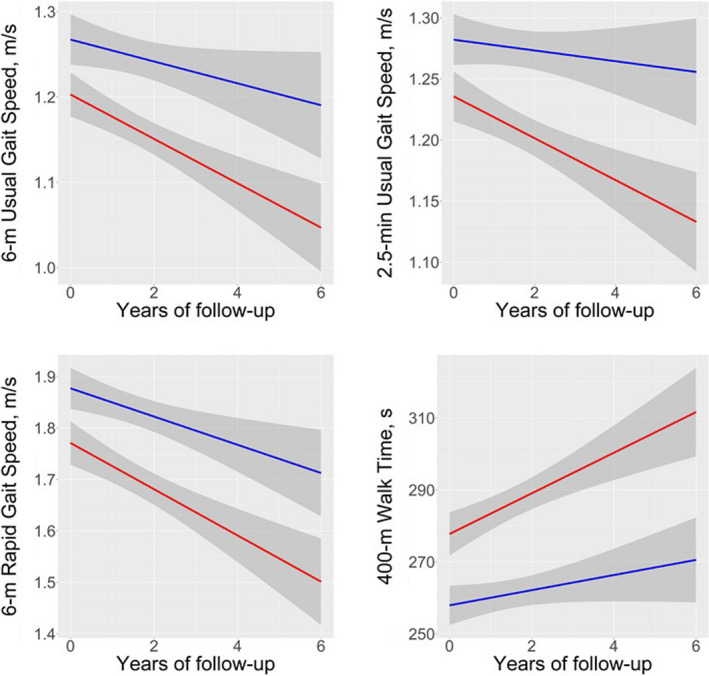
FIGURE 1.

Predicted mobility changes among those with low (lowest tertile: red) and high (highest tertile: blue) baseline kPCr. Legend: Predicted mobility changes are adjusted for covariates, including baseline age, sex, extent of PCr depletion during exercise, and body mass index over time
