
FIGURE 1.
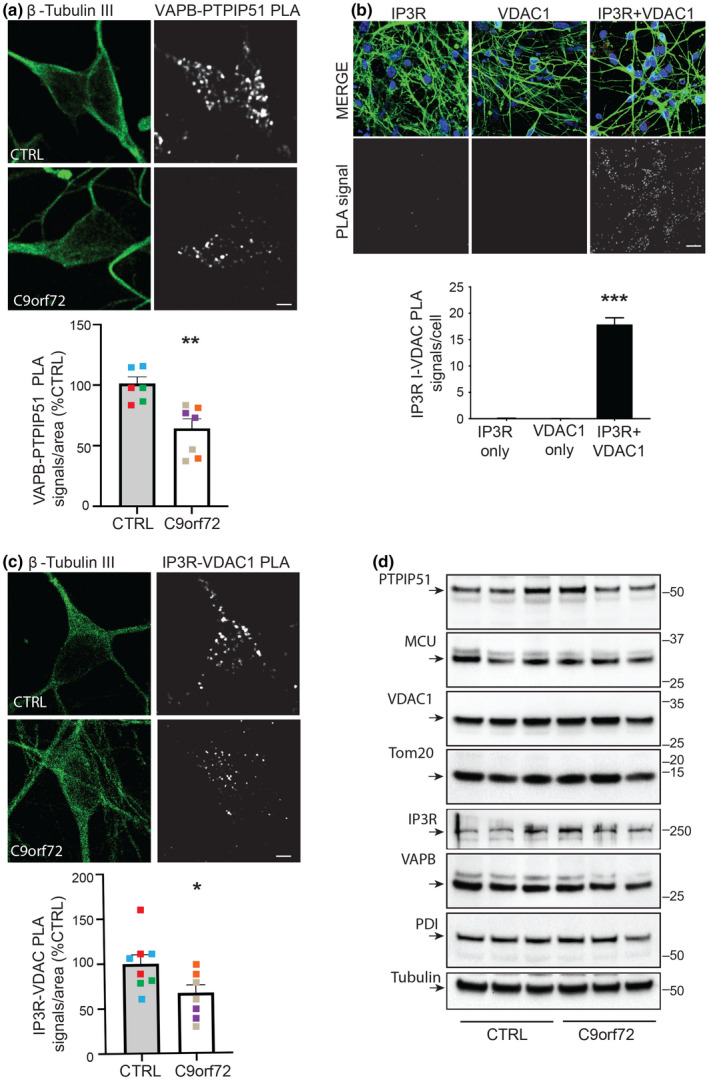
VAPB‐PTPIP51 tethers and IP3 receptor‐VDAC1 interactions are disrupted in iPS cell‐derived neurons from patients carrying pathogenic C9orf72 expansions but these disruptions do not involve changes in expression of VAPB, PTPIP51, IP3 receptor type 1, VDAC1 or other key ER‐mitochondria signalling proteins. (a, c) Representative projected Z‐stack confocal images of VAPB‐PTPIP51 (a) and IP3 receptor type‐1‐VDAC1 (c) PLAs in control and C9orf72 patient iPS cell‐derived cortical neurons. Cells were also stained for βIII‐Tubulin to confirm neuronal identity. Scale bars = 5 μm. Bar charts show numbers of PLA signals per cell after correction for cell size and are shown after normalisation to control lines. Quantifications were from three independent healthy control (red, green and blue) and three independent C9orf72 patient lines (purple, grey and orange), and are from 2 to 3 independent inductions per line. In (a) n = 218 control and n = 333 C9orf72 patient neurons. In (c) n = 476 control and n = 417 C9orf72 patient neurons. Data were analysed by Mann–Whitney U test; *p ≤ 0.05; **p ≤ 0.01. Error bars are standard error of means (SEM). For ease of comprehension, pooled data from all control and C9orf72 patient cases are shown in the bar charts. However, analyses of the individual patient data also revealed a significant reduction in VAPB‐PTPIP51 PLA signals in each of the C9orf72 cases compared to controls (***p ≤ 0.001 for all C9orf72 cases; one‐way analyses of variance (ANOVA), Dunn's multiple comparison test). (b) Control experiments demonstrating the specificity of the IP3 receptor type‐1‐VDAC1 PLAs. Controls included omission of IP3 receptor type 1 (IP3R) or VDAC1 primary antibodies. Samples are counterstained with DAPI to show nuclei and βIII‐Tubulin, showed in MERGE. Graph shows PLA signals per cell. Data were analysed by one‐way ANOVA and Tukey post hoc test. N = 37–40 neurons. Error bars are SEM; ***p ≤ 0.001. Scale bar = 30 μm. (d) C9orf72 iPS cell‐derived neurons do not display changes in expression of VAPB, PTPIP51 or other key ER‐mitochondria Ca2+ exchange proteins. Representative immunoblots for VAPB, PTPIP51, VDAC1, IP3R type I, MCU, PDI, TOM20 and βIII‐tubulin as a loading control are shown. Molecular mass markers are indicated in kDa. Signals were normalised to βIII‐tubulin signals, and data were analysed by Mann–Whitney U test; no significant differences between control and C9orf72 lines were detected for any protein