
FIGURE 3.
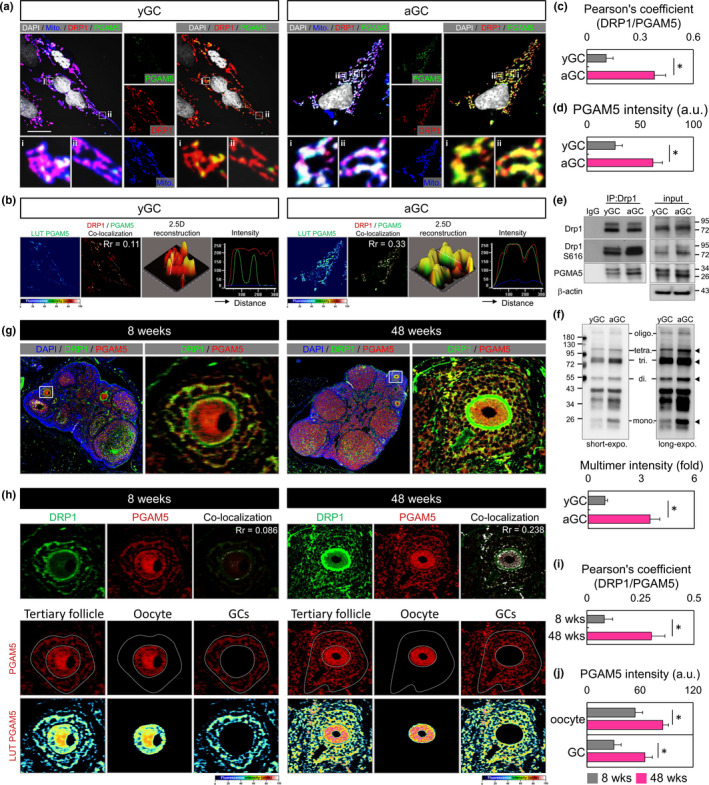
Drp1 interacts with and recruits PGAM5 to mitochondria. (a) Fluorescence images of GC stained with MitoTracker, Drp1, PGAM5, and DAPI. The enlarged images in (i, ii) highlight the representative co‐localization from white squares in the overlay images. The pseudo‐color image shows the PGAM5 fluorescence intensity. (b) PGAM5 green fluorescence is converted to a pseudocolor with a relative intensity scale. The co‐localization of DRP1 and PGAM5 are presented as the product of the differences from the mean (PDM) image. White color pixels indicate the co‐localization coefficient. A 2.5‐dimensional reconstruction and fluorescence intensity of the respective insets in (i) compared between green and red fluorescence. (c–d) Quantify (a–b) Pearson's coefficient of the colocalization and PGAM5 fluorescence intensity in yGC and aGC. (e) Immunoblot analysis of proteins immunoprecipitated with anti‐Drp1 and IgG antibodies in GC. (f) Non‐reducing SDS/PAGE immunoblot of PGAM5. Long exposure revealed tetramer and oligomer. (g) Fluorescent ICC showing expression and localization of PGAM5 and DRP1 in the ovary of mice at 8 and 48 weeks. (h) The co‐localization of DRP1 and PGAM5 is presented as the product of the differences from the mean (PDM) image; compared between green and red fluorescence. The fluorescence intensity of PGAM5 in oocytes and GC in the ovary of different ages. (i–j) Quantify (g–h) Pearson's coefficient of the colocalization and PGAM5 fluorescence intensity at different mouse age. Scare bar = 20 µm. *p < 0.05