FIGURE 5.

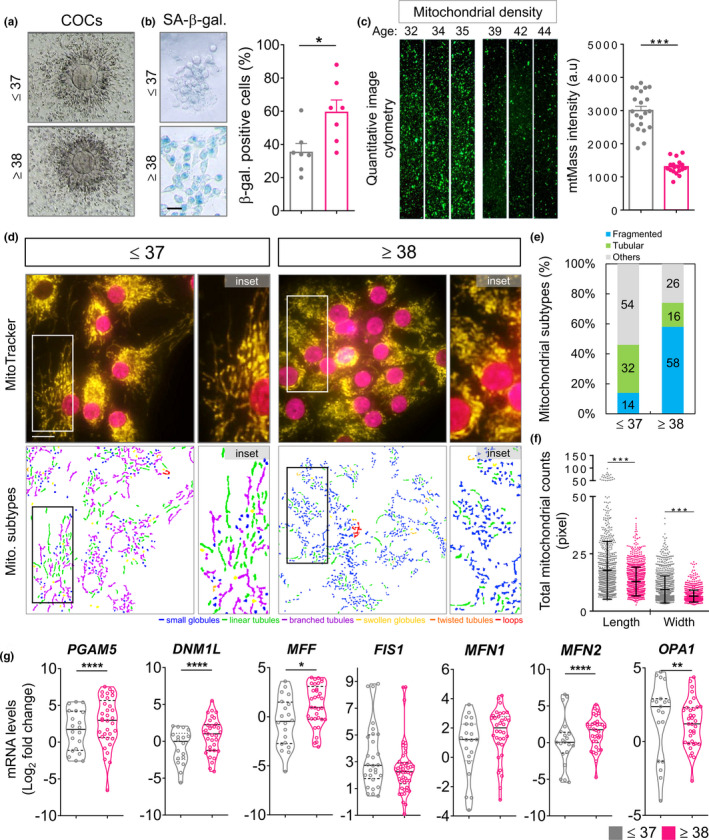
Mitochondrial architecture and gene expression in CC of patients. (a) The representative cumulus–oocyte complexes (COCs) from the ≤37 and ≥38 groups were shown. (b) The representative CC with senescence‐associated β‐galactosidase (SA‐β‐gal) staining from the ≤37 and ≥38 groups were shown. (c) CC were stained with MitoTracker green, and the mitochondrial mass was measured by image cytometry. The relative mean of mitochondrial mass intensity was calculated. (d) CC were stained with MitoTracker and observed by fluorescence microscopy to analyze the mitochondrial network structure. Mitochondria inpatient CC were labeled with MitoTracker and subjected to image capture. The mitochondria were classified according to their morphology: globules, linear tubules, branched tubules, twisted tubules, and loops. (e) Three major types of mitochondria were quantified: fragmented, tubular, and others. (f) The total length and width of each mitochondrion were evaluated. (g) Quantitative qPCR reaction analysis for the ≤37 and ≥38 groups. *p < 0.05, **p < 0.01, ***p < 0.001, and ****p < 0.0001. Scare bar = 20 µm
