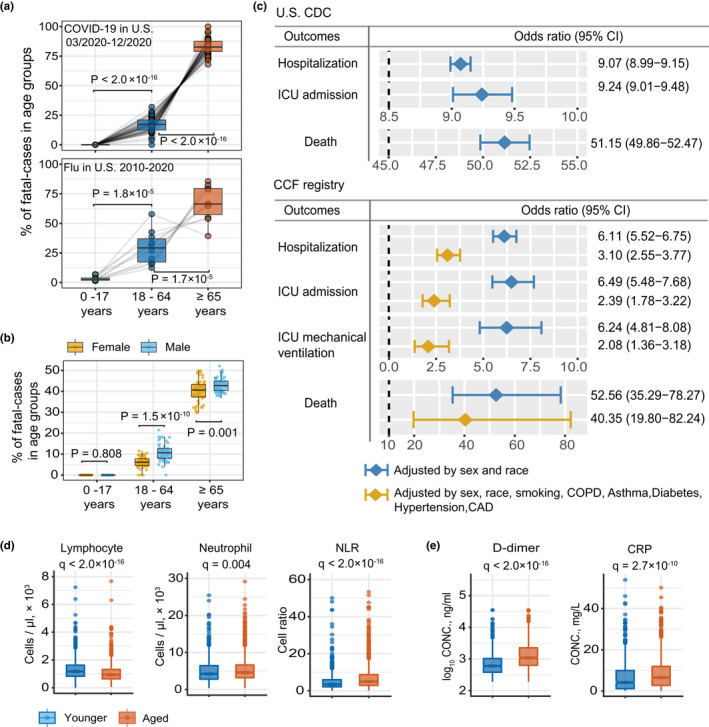
FIGURE 1.

Epidemiological data analysis between aged and younger COVID‐19 patients. (a) The percentage of fatal cases of COVID‐19 and flu across three age groups. Data source from U.S. CDC. The upper panel shows the percentage of fatal cases of COVID‐19 in the United States. Each dot in the boxplot represents one state. The lower panel shows the percentage of fatal cases of flu from 2010 to 2020. Each dot in the boxplot represents one flu season. Statistical p‐value was computed by two‐tailed paired t test. For details about CDC dataset, see Tables S1 and S2. (b) Sex differences in the percentage of fatal cases of COVID‐19 across three age groups. (c) Odds ratio (OR) analysis of U.S. CDC and COVID‐19 registry datasets. U.S. CDC dataset, “Younger” is defined as 20 to 49 years of age (n = 2,369,919), and ‘aged’ is defined as >60 years old (n = 1,048,011); COVID‐19 registry dataset, “Younger” is defined as 18 to 55 years of age (n = 12,651), and ‘aged’ is defined as ≥65 years old (n = 32,426). OR >1 indicates aged COVID‐19 patients with increased likelihood of hospitalization, ICU admission, and death. Two colors denote OR models with different adjusted confounders. Features of the COVID‐19 registry dataset are shown in Table S3. (d) and (e) Boxplot show the lab testing values of five inflammatory markers between aged (>65 years, n = 1405) and younger (18 to 55 years, n = 970) individuals. Adjusted p‐value [q] was computed by Mann–Whitney U test with Benjamini–Hochberg (BH) multiple testing correction
