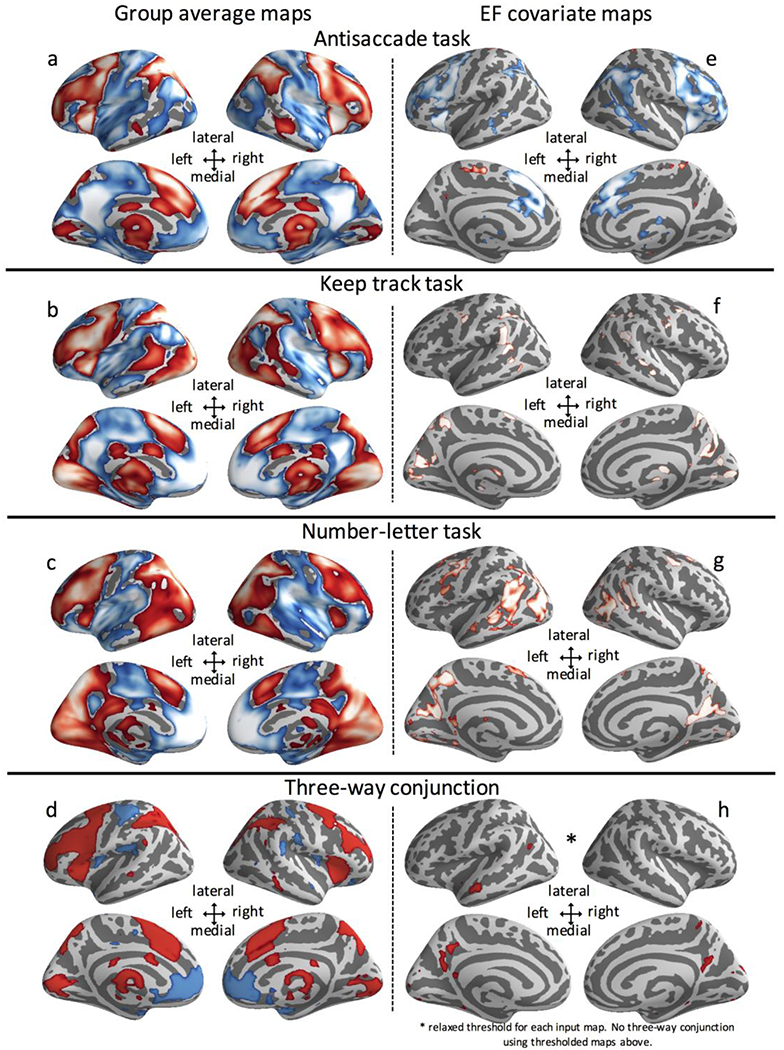
Figure 1. fMRI results.

a-c. Group average activation for antisaccade, keep track, and number–letter tasks. d. Conjunction of group average map from all three tasks. e-g. Common Executive Functioning (cEF) covariate analyses. Individual differences maps for antisaccade, keep track, and number–letter tasks. h. Conjunction of individual differences maps for antisaccade, keep track, and number–letter tasks. Input maps are thresholded at pfdr < ∛0.05 = 0.368 rather than pfdr < 0.05 as in panels e, f, and g. red = positive activation or covariate association, blue = negative activation or covariate association
