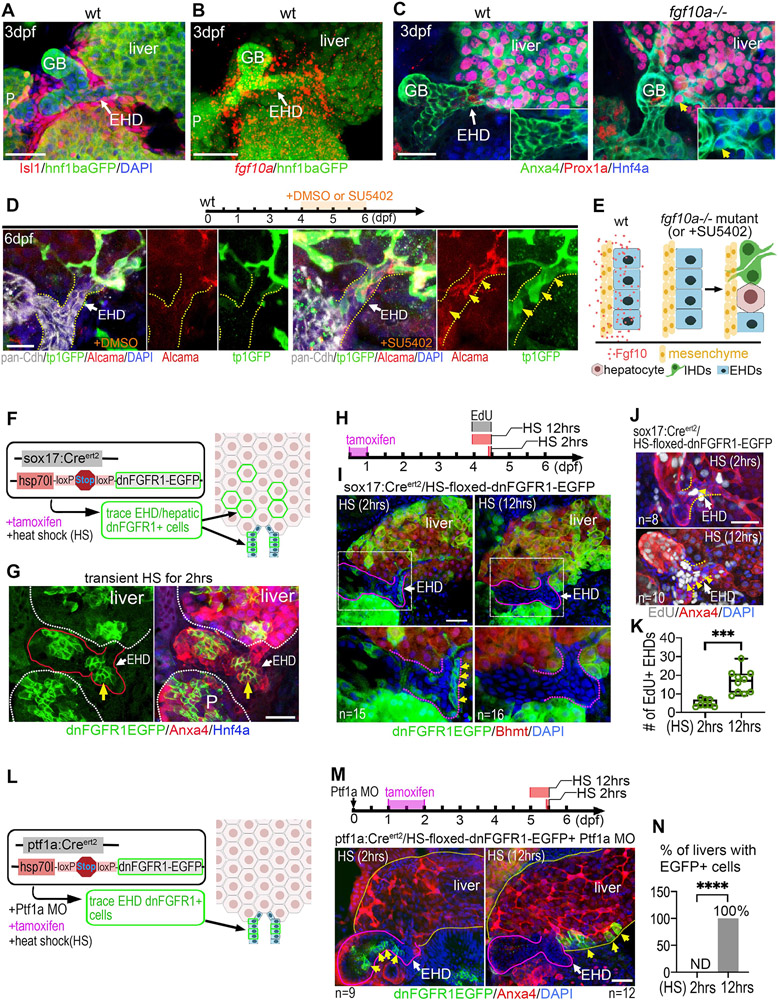
Figure 6. Fgf signaling directly maintains progenitors in the EHD niche by preventing their premature differentiation and allocation into the liver.
(A) Dense mesenchymal cells (Isl1+) surrounding the EHD of wt zebrafish at 3 dpf (n=9). hnf1ba:EGFP+ foregut endoderm showing the EHD and the liver, pancreas (P), and gallbladder (GB). (B) Fluorescent in situ hybridization (FISH) showing high fgf10a expression surrounding the EHD of wt zebrafish at 3 dpf (n=5). (C) EHD (Anxa4+) at 3 dpf showing ectopic co-expression of Prox1a and Hnf4a (inset; yellow arrow) in fgf10a−/− mutants but not in wt (n=16). (D) (top) Timeline of DMSO control and FGFR inhibitor SU5402 dosing experiment. (bottom) pan-Cdh+ EHD (yellow dotted lines) in wt at 6 dpf treated with DMSO (left) or SU5402 (right; 2μM) at 4-6 dpf showing ectopically expressed IHD markers (tp1:GFP and Alcama; yellow arrows) (n=7) in the EHD after SU5402 treatment. (E) Model depicting Fgf10a ligand signaling from mesenchymal cells directly to adjacent EHD cells to inhibit differentiation into liver cell fates. (F) Lineage tracing strategy to label clones of endoderm cells with inhibited Fgf receptor signaling using sox17:CreERt2 and heat-shock inducible Cre responder hs:switch2dnFGFR. (G) dnFGFR1-EGFP+ clones of cells appear in the EHD (yellow arrow), liver, and pancreas (P) at 4 dpf following tamoxifen treatment and a 2hr heat-shock. EHD and GB are outlined in red. (H) Tamoxifen (8-24 hpf) and EdU (4-4.5 dpf) treatments, with heat-shock for either 2 hours (control) or 12 hours (4-4.5 dpf) to induce dnFGFR1-EGFP expression. (I) dnFGFR1-EGFP+ clones after 2 or 12hr heat shock with EHD region (boxed) magnified below and outlined with purple dotted lines. dnFGFR1-EGFP+ cells (green membrane; yellow arrows) were found in all EHDs (n=15/15) following a 2hr heat shock, but not detected in the EHD (n=0/16) following a 12hr heat shock. (J) EdU+ cells in EHD (outlined with yellow dotted lines) with either 2 or 12hr heat shock, showing increased EdU+ EHD cells after a prolonged heat shock. 12hr EdU treatment. (K) Number of EdU+ EHD cells following 2hr (n=8) and 12hr (n=12) heat shock induction of dnFGFR1-EGFP. (L) Lineage tracing strategy to label clones of cells with inhibited Fgf receptor signaling in the EHD but not in the liver, using ptf1a:CreERt2 , Ptf1a MO, and hs:switch2dnFGFR as depicted. (M) (Top) Tamoxifen exposure at 24-48 hpf followed by heat shock induction of dnFGFR1-EGFP at 5 dpf for 2hrs (control) or 12hrs. (bottom) dnFGFR1-EGFP+ clones (green; yellow arrows) are found in the EHD (outlined with white dotted lines) after a 2hr heat shock (n=9), but located in the liver after a 12hr heat shock (n=12). (N) Percentage of livers with dnFGFR1-EGFP+ cells following a 2hr (n=9) and 12hr (n=12) heat-shock. Scale bars, 50μm.

