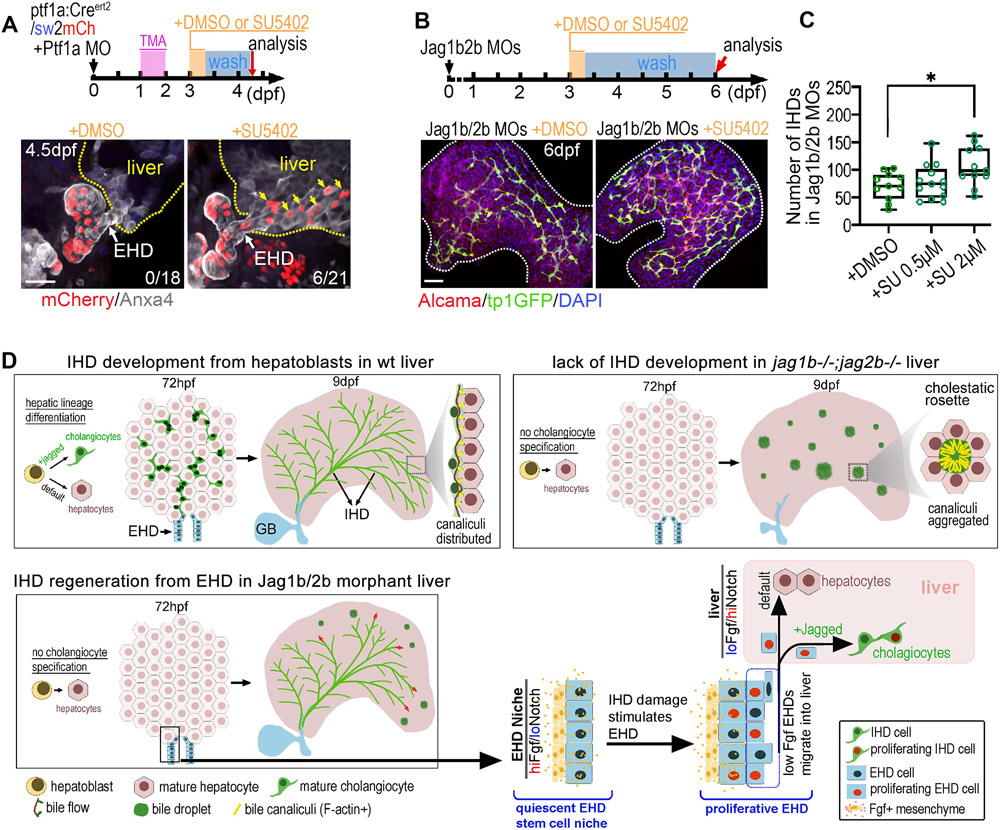
Figure 7. Chemical inhibition of Fgf signaling stimulates allocation of EHD cells into liver and accelerates IHD cell regeneration.
(A) (top) EHD lineage tracing approach using ptf1a:CreERt2, sw2mCh, and Ptf1a MO, with transient exposure to DMSO or SU5402 (2μM) for 8hrs at 3 dpf and analyzed at 4.5 dpf. (bottom) Lineage traced EHD cells (mCherry+) are restricted to EHD in DMSO treated controls (n=0/18), but appear in liver (yellow arrows) following SU5402 treatment (n=6/21). (B) (top) Jag1b/2b morphants treated with DMSO or SU5402 for 8hrs at 3 dpf and analyzed at 6 dpf. (bottom) Regenerating IHDs (tp1:GFP+/Alcama+) in whole liver of Jag1b/2b morphants at 6 dpf after DMSO or SU5402 treatment. (C) Number of regenerated IHD cells in Jag1b/2b morphants with DMSO or SU5402 treatment (8hrs; 0.5 μM and 2μM). (D) Working models of IHD development in wt zebrafish, IHD development failure in jag1b/2b mutants, and EHD-mediated regeneration of IHD cells in Jag1b/2b morphants. Scale bars, 50μm.

