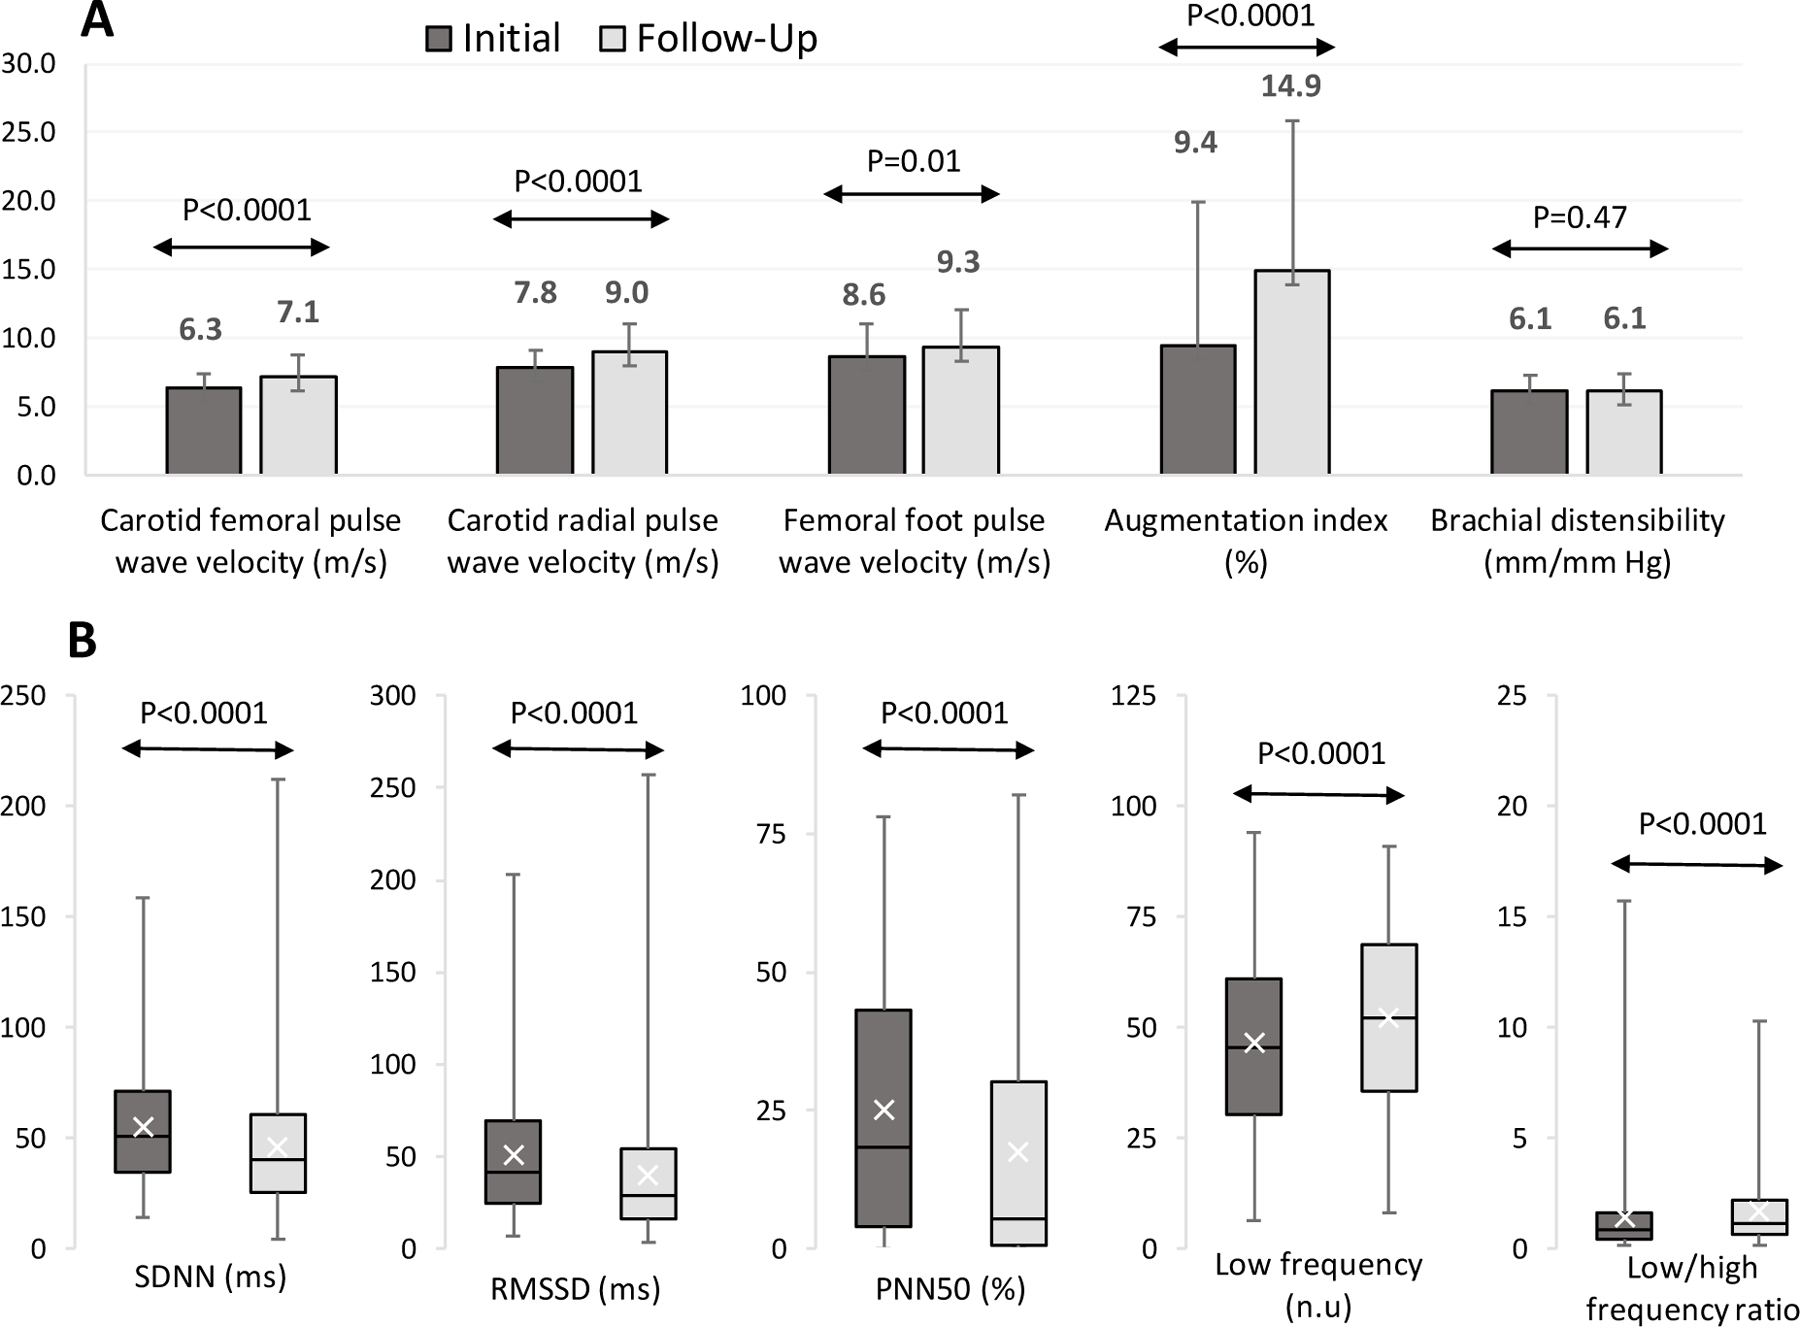
Figure 1.

Arterial Stiffness (Panel A) and Heart Rate Variability (Panel B) Outcomes in the TODAY Participants (N=304) at the Initial (2013–2014) and 5-Year Follow-Up (2018–2019) Assessment*
Panel A: Mean ± SD at initial and 5-year follow-up assessment for the arterial stiffness measures. Panel B: median [25th −75th percentile] at initial and 5-year follow-up assessment for the heart rate variability measures. SDNN: SD of the NN intervals; RMSSD: root mean square differences of successive NN intervals; PNN50: percent of adjacent NN intervals with a difference greater than 50msec; n.u.normalized units. * P-value testing paired differences between the initial vs. the 5-year follow-up assessment, using at-test for continuous measures from adjusted models for age, sex, and race-ethnicity. Higher value is worse for all arterial stiffness measures except brachial distensibility, for low frequency, and for low frequency/high frequency ratio; Lower value is worse for all others.
