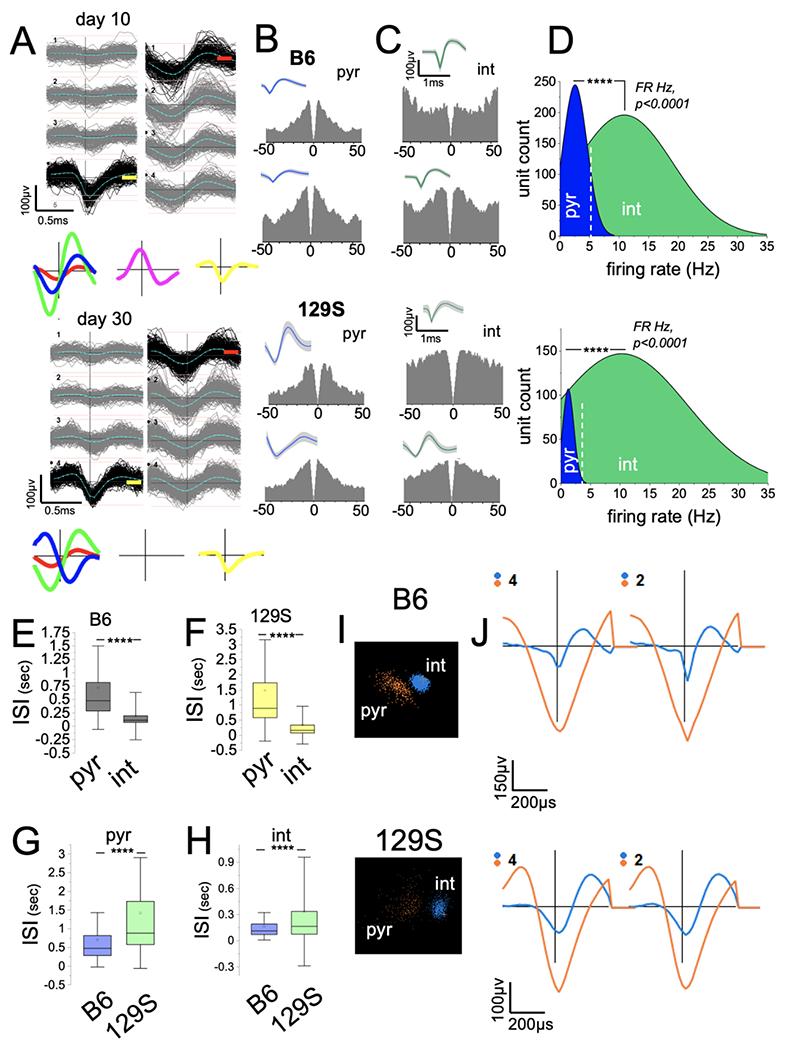
Figure 2: Detection of putative units in the CA1 in 129S and B6 mice.

A, PCA sorting of continuously recorded extracellular spikes demonstrating putative neuron clusters in the CA1 of a mouse after 10 and 30 days.
B-C, Sample autocorrelograms (ACGs; 0.5 ms bins) and waveform for putative pyramidal cell (B, pyr) and interneuron (C, int) units detected in B6 and 129S CA1.
D, Firing rate (FR Hz) distribution for neurons shows the clustering of ACG/waveform characterized putative pyr and int units (****p<0.0001, Mann-Whitney U test).
E-F, Graph illustrating higher ISI scores for putative pyr cells and lower ISI scores for int units in B6 (E, p<0.0001) and 129S (F, p<0.0001) CA1 ensembles (Mann-Whitney U test).
G-H, Graphs showing significantly higher ISI scores for 129S putative pyr (G, p<0.0001) and int (H, p<0.0001) units than for B6 putative units (Mann-Whitney U test).
I, Sample of putative pyr and int clusters in three-dimensional PCA clustering.
J, Waveforms corresponding to pyr and int waveform clusters.
