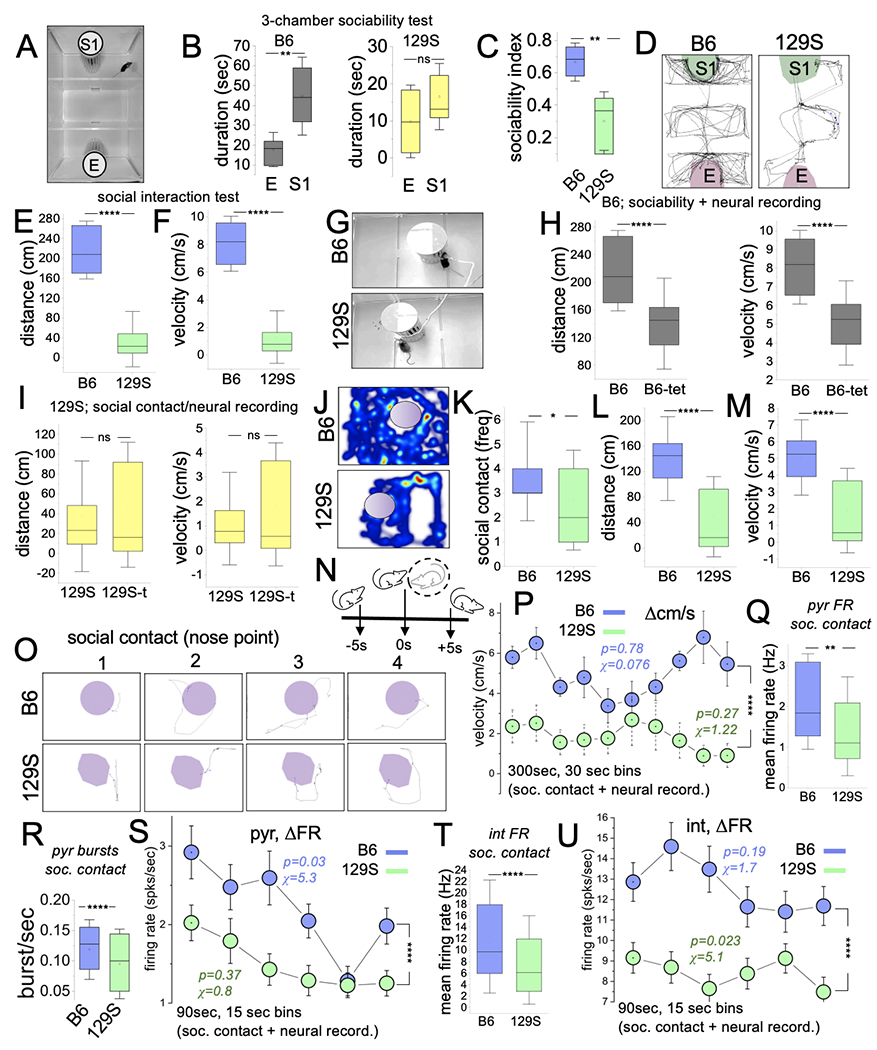
Figure 5: 129S mice show significant social deficits.

A, Three-chambered setup for a sociability test.
B, Graphs comparing the time spent exploring the empty and stranger mouse chambers for B6 and 129S mice in sociability tests. S1 was significantly higher for B6 mice (p=0.002). No significant difference was found between S1 and E for 129S mice (p=0.351, T-test).
C, Graph demonstrating a lower sociability index for 129S mice when compared with B6 mice (T-test, p=0.002).
D, Representative mouse trails comparing the exploratory activity for untethered 129S mice and B6 mice during sociability tasks.
E-F, Graph illustrating a lower distance (p=0.002) and velocity (mean) for untethered 129S mice during sociability tests (Mann-Whitney U test, p<0.0001).
G, Experimental setup for a sociability test in tethered 129S and B6 mice.
H, Graph showing significantly lower distance (p<0.0001) and velocity (p<0.0001) for tethered B6 mice than B6 mice without neural implants/tethers during the sociability task (Mann-Whitney U test).
I, Graph comparing the mean distance (p=0.30) and velocity (p=0.38) for tethered 129S mice with or without neural implants/tethers in the sociability task (Mann-Whitney U test).
J-K, Representative heatmaps, and graph illustrating the lower activity of 129S mice around the stranger mouse holding compartment. The frequency of social contact was lower for 129S mice than B6 mice (Mann-Whitney U test, p=0.014).
L-M, Graph illustrating the comparative mean distance (p<0.0001) and mean velocity (p<0.0001) for tethered 129S and B6 mice in sociability tasks (Mann-Whitney U test).
N, Cartoon illustration of a social contact event.
O, Sample of intervals for social contact bouts for a B6 and a 129S mouse.
P, Interval plot of velocity spread (Δcm/s) for 30-sec bins in sociability tasks (two-way ANOVA, p<0.0001). B6 (chi-sq=0.076, p=0.78) and 129S (chi-sq=1.22, p=0.27) mice exhibited sustained speed for the task duration. The velocity score for 129S mice was significantly lower for all intervals of the task.
Q-R, Graphs illustrating a low mean FR (p=0.0053) and burst rate (p<0.0001) scores for 129S putative pyr units in sociability tasks.
S, Interval plot of FR (ΔFR) for putative pyr cells in sociability tasks (two-way ANOVA, p<0.0001). The 129S pyr cells had low FR scores (spikes/sec) for the selected duration. ΔFR for B6 (chi-sq=5.3, p=0.03), and not 129S (chi-sq=0.8, p=0.37) pyr neurons decreased during the intervals of sociability tasks.
T, Graphs illustrating a low mean FR for 129S putative int units during sociability tasks (two-way ANOVA, p<0.0001).
U, Interval plot of putative int ΔFR in sociability tasks. No significant change in ΔFR was observed for B6 int (chi-sq=1.7, p=0.19). The 129S int change in FR significantly decreased for similar intervals of the same task (chi-sq=5.1, p=0.023).
