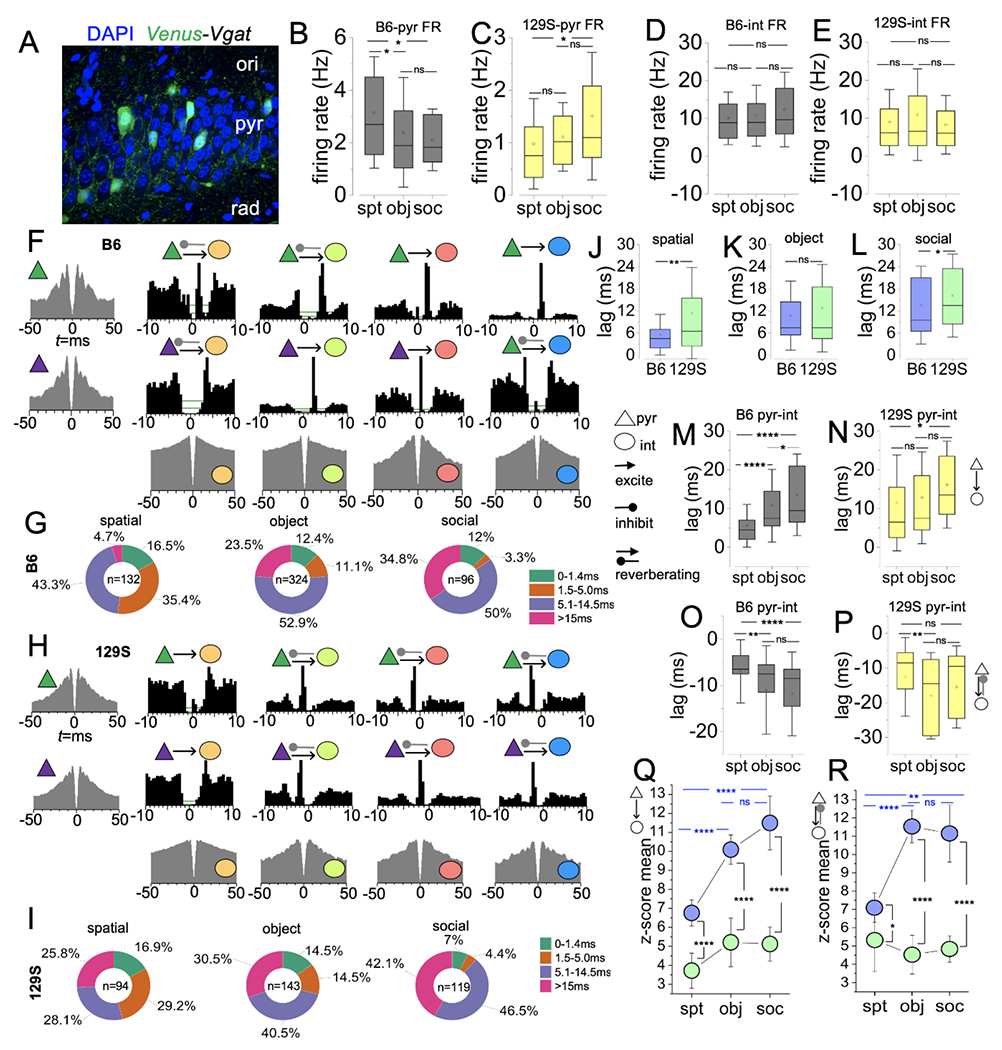
Figure 7: Cross-correlogram analysis of pyr/int putative pairs in 129s and B6 CA1 neuronal ensembles.

A, Fluorescence image demonstrating the distribution of VGAT+ cells (inhibitory GABA neurons) in the layers of the CA1.
B, Graph comparing the FR of B6 putative pyramidal cells across behavioral tasks (one-way ANOVA, spt vs obj: p=0.02, spt vs soc: p=0.05, obj vs soc: p=1).
C, Graph comparing the FR of 129S putative pyramidal cells (one-way ANOVA, spt vs obj: p=1, spt vs soc: p=0.01, obj vs soc: p=0.08).
D, Graph comparing the FR of B6 putative interneurons (one-way ANOVA, spt vs obj: p=1, spt vs soc: p=0.1, obj vs soc: p=0.2).
E, Graph comparing the FR of 129S putative interneurons (one-way ANOVA, spt vs obj: p=0.3, spt vs soc: p=1, obj vs soc: p=0.06).
F, ACGs (edge), and CCHs (inner) showing representative reference pyramidal cells and target interneurons in B6 CA1 neuronal ensembles.
G, Pie charts illustrating pairs with positive CCH peak, and the distribution of pyr/int pairs based on the lag (ms) of CCH peaks for B6 neuronal ensembles.
H, Representative ACG/CCH for 129S CA1 neuronal ensembles.
I, Pie chart depicting CCH peak lag distribution for pyr/int pairs in 129S CA1 ensembles.
J-L, Graph comparing positive CCH lag for B6 and 129S pyr/int pairs (average) during cognitive tasks (T-test); spatial p=0.007; object exploration p=0.34, and sociability p=0.04.
M, Graph comparing the mean CCH lag duration for B6 pyr/int pairs in cognitive tasks (one-way ANOVA). The decrease in monosynaptic connections for cortex-linked executive tasks agrees with a significant increase in CCH peak lag for object exploration (p<0.0001) and sociability tasks (p<0.0001), versus spatial exploration tasks. Similarly, dramatic reduction of monosynaptic inputs in sociability tasks, versus object exploration, is evident as an increase in CCH lag (p=0.02).
N, Graph comparing the mean CCH lag duration for 129S pyr/int pairs in cognitive tasks (one-way ANOVA). No significant difference in CCH peak lag for spatial vs object exploration task (p=1) and object exploration versus sociability task (p=0.08). CCH lag peak is significantly delayed for sociability tests in comparison with spatial exploration tasks (p=0.02).
O, Graph comparing negative CCH peak positions for B6 pyr/int pairs (one-way ANOVA). CCH peaks show prolonged inhibitory effects for reverberating pyr/int pairs in executive tasks in comparison with spatial exploration tasks (spt vs obj: p<0.0001, spt vs soc: p=0.001). There is no significant change in the negative CCH peak position for putative pairs in object exploration and sociability tasks (p=1).
P, Graph comparing negative CCH peak positions for 129S pyr-int pairs (one-way ANOVA). CCH peaks show prolonged inhibitory effects for reverberating pyr/int pairs in object exploration (p=0.004), and not sociability tasks (p=0.3), versus spatial exploration. There is no significant change in the negative CCH peak position for putative pairs in object exploration and sociability tasks (p=0.2).
Q, Graph comparing the mean z-score of excitatory CCH peak lags for B6 or 129S putative pyr/int pairs in cognitive tasks. one-way ANOVA (B6: spt vs obj, p<0.0001; spt vs soc, p<0.0001; obj vs soc, p=0.21 | 129S: spt vs obj, p=0.3; spt vs soc, p=0.5; obj vs soc, p=1). Also, the graph compares B6 and 129S for specific behavioral tasks (T-test, spt, p<0.0001; obj, p<0.0001; soc, p<0.0001).
R, Graph comparing the mean z-score of reverberating CCH peak lags for B6 and 129S putative pyr/int pairs in cognitive tasks. one-way ANOVA (B6: spt vs obj, p<0.0001; spt vs soc, p=0.002; obj vs soc, p=0.2 | 129S: spt vs obj, p=1; spt vs soc, p=1; obj vs soc, p=1). Also, the graph compares B6 and 129S for specific behavioral tasks (T-test, spt, p=0.046; obj, p<0.0001; soc, p<0.0001).
