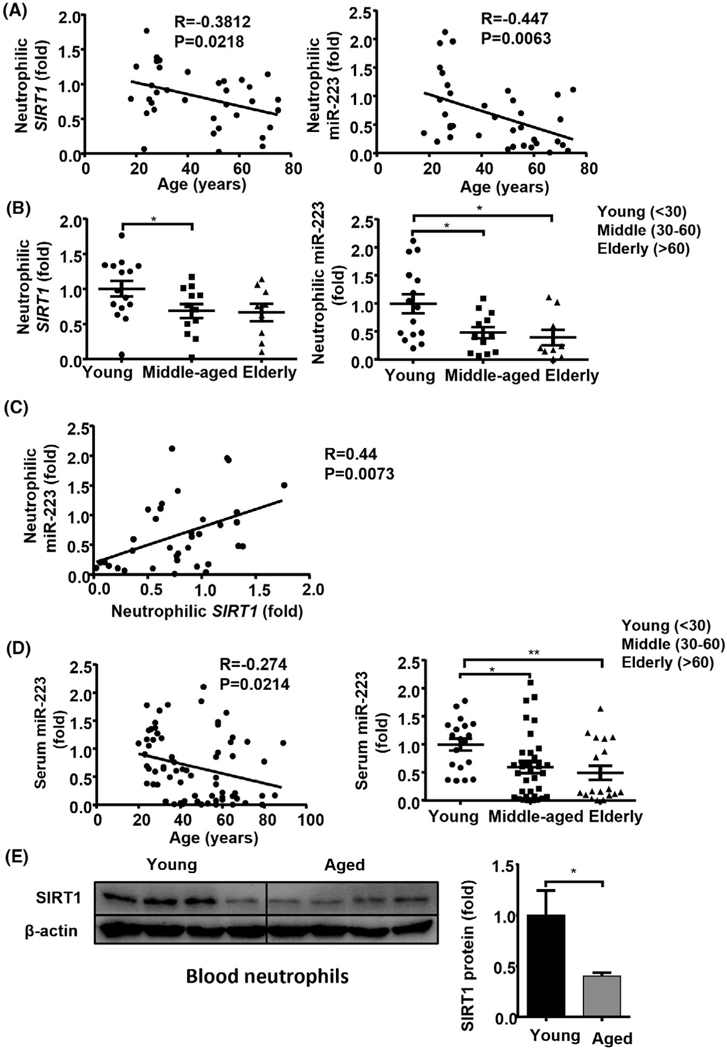
FIGURE 7.
Down-regulation of neutrophilic SIRT1 and miR-223, and serum miR-223 in middle-aged and elderly subjects. (A–C) Peripheral blood neutrophils were collected from young (n = 15), middle-aged (n = 12), and elderly (n = 9) healthy controls (Table S1) and were subjected to RT-qPCR analyses of SIRT1 and miR-223. Correlation analyses between age and neutrophilic SIRT1 or miR-223 (A); expression levels of SIRT1 and miR-223 (B); correlation analyses between neutrophilic SIRT1 and miR-223 (C). (D) Serum was collected from young (n = 67), middle-aged (n = 48) and elderly (n = 31) healthy controls (Table S2). Correlation analyses between age and serum miR-223 (left panel), RT-qPCR analyses of serum miR-223 (right panel). (E) Western blot analysis of SIRT1 protein levels from blood neutrophils in young (n = 4) and elderly (n = 4) healthy controls. Values represent means ± SEM. *p < 0.05; **p < 0.01

