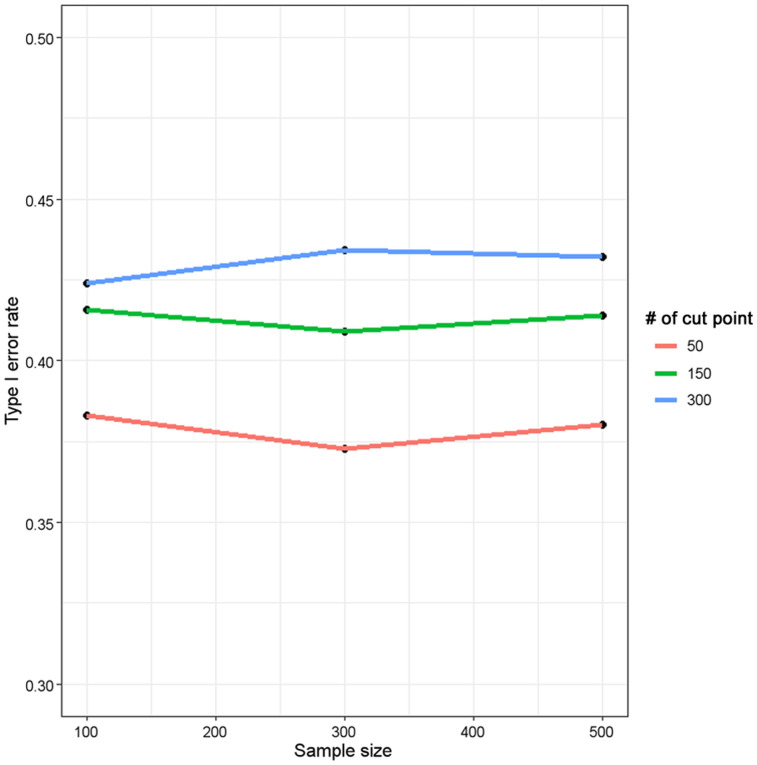
FIGURE 4.
Type I error inflation as function of number of cut points and sample size using minimal-P-value approach. In each simulation, 10% of smallest and largest biomarker values were not considered as potential cut points. Two-sided P value from log-rank test was computed for each cut point applied. Each plotted point represents percentage of 5,000 simulations for which minimal P value is less than nominal 5% level based on assumption that there is no association between biomarker and time-to-event outcome (i.e., type I error). No censoring in outcome was assumed.

