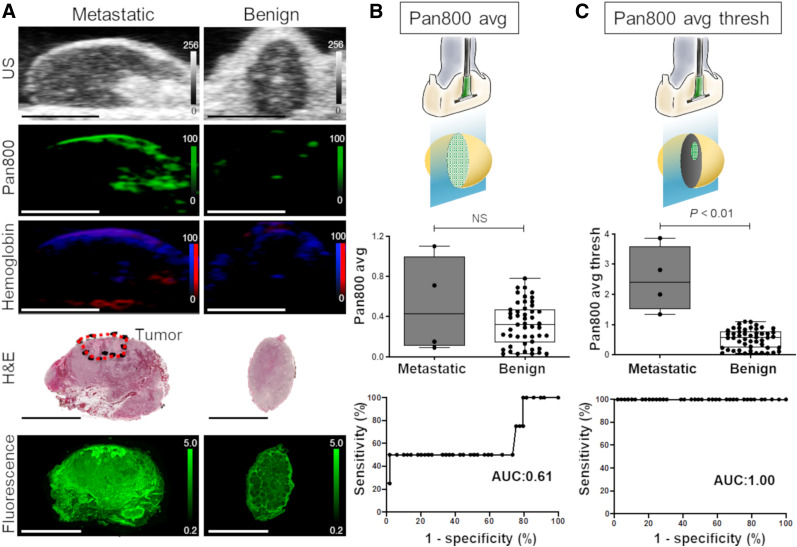
FIGURE 6.
Photoacoustic measurements for metastatic and benign LNs. (A) Representative ultrasound, spectroscopic photoacoustic, fluorescence, and histology images of benign and metastatic LNs. Photoacoustic signals corresponding to pan800 and oxy- and deoxyhemoglobin have been spectrally unmixed. All scale bars are 5 mm. (B) Quantitative analysis of PAMI signal using pan800 avg. (C) Quantitative analysis of PAMI signal using pan800 avg thresh. US = ultrasound.

