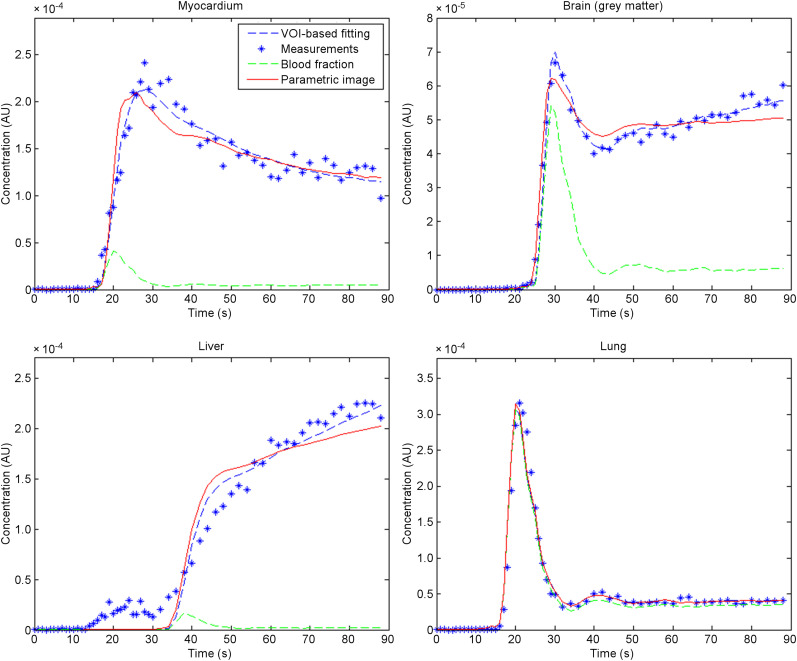
FIGURE 6.
Time–activity curve measured from dynamic frames (blue dots) and fitted curves using proposed method, and fitting based on time–activity curve from VOI in 4 different organs: myocardium, brain, liver, and lung. For better illustration of delay time, corresponding blood fraction in time–activity curve was also plotted. AU = arbitrary units.

