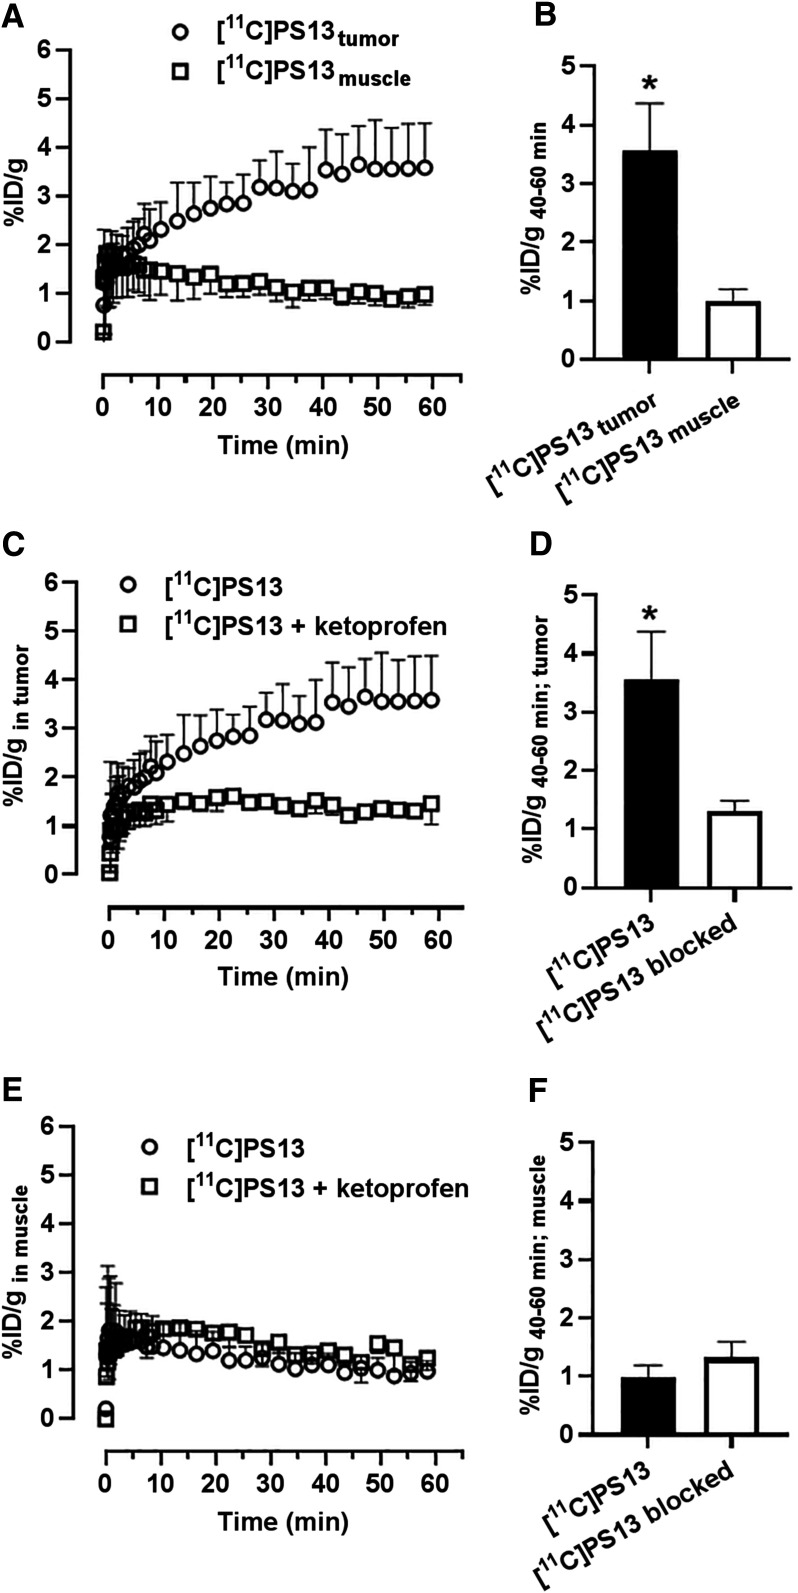
FIGURE 3.
(A, C, and E) Time–activity curves of 11C-PS13 in tissues of OVCAR-3 subcutaneous xenograft mice over 60 min in tumor tissue and muscle tissue (A), tumor under baseline and blocked conditions (C), and muscle tissue under baseline and blocked conditions (E). (B, D, and F) Average uptake at 40–60 min in tumor and muscle tissue (B), tumor under baseline and blocked conditions (D), and muscle tissue under blocked and unblocked conditions (F). *Significant differences.

