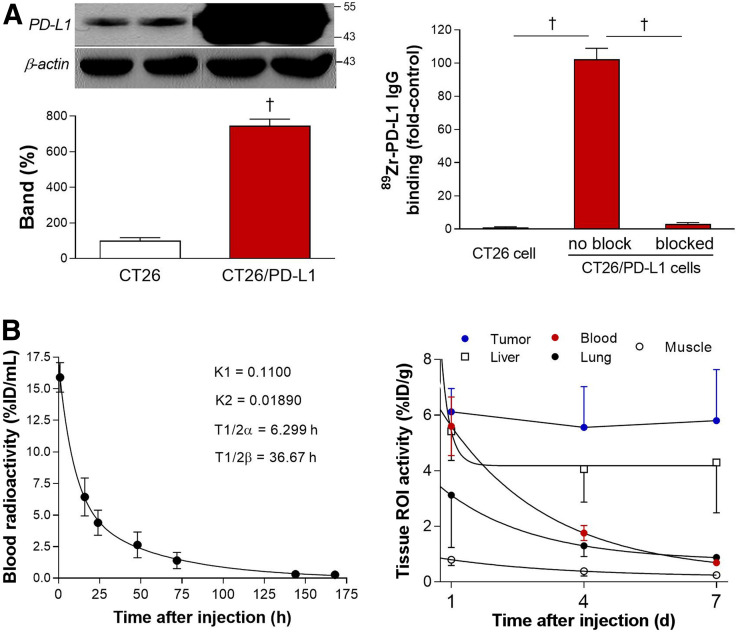
FIGURE 2.
Cell binding and pharmacokinetic properties. (A) Western blotting of PD-L1 (left) and 89Zr-anti-PD-L1 binding (right) are shown for CT26 and CT26/PD-L1 cancer cells. Bars are means ± SDs. † P < 0.005. (B) Time-dependent blood clearance in normal mice shows early and late rate constants (K 1 and K 2) and half-lives (T½α and T½β) (left). Pharmacokinetic profile in major organs and tumor was measured by PET-based analysis in CT26/PD-L1 tumor mice (n = 5) at 1, 4, and 7 d (right). ROI = region of interest.

