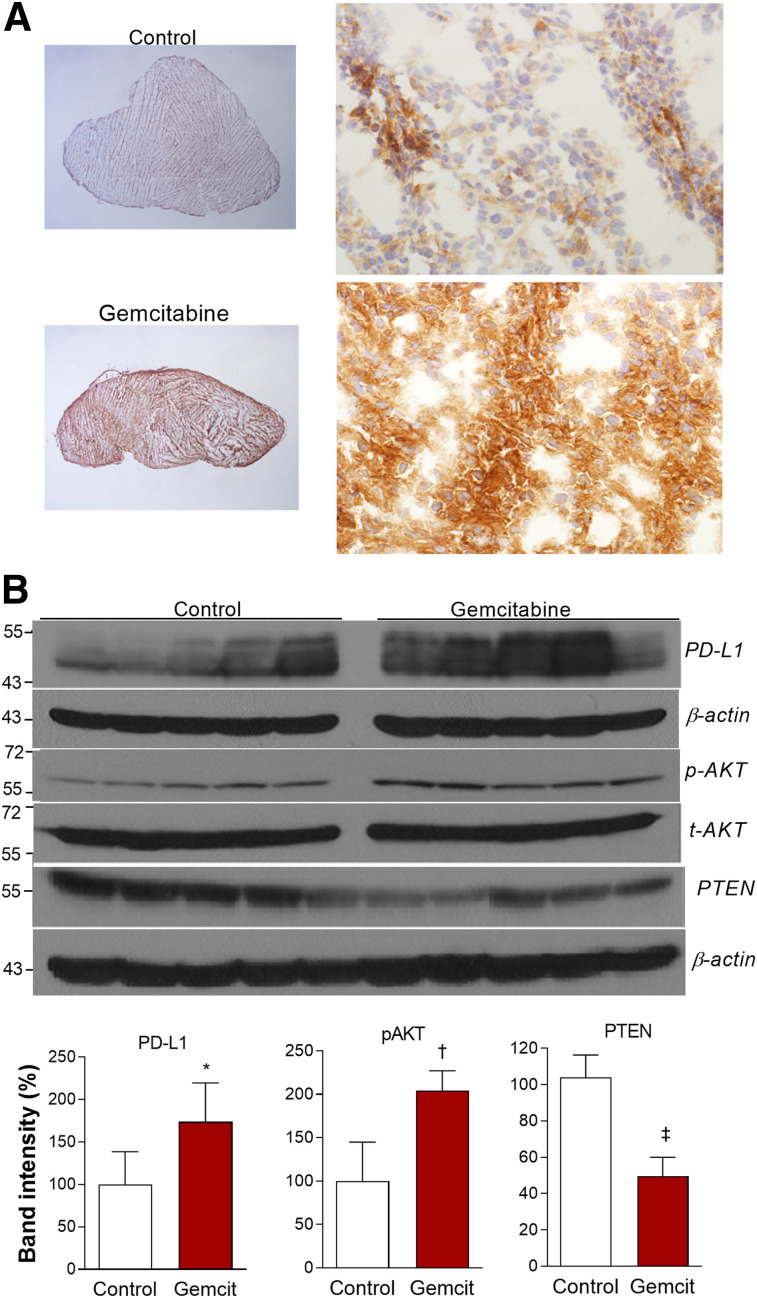
FIGURE 7.
Effects of gemcitabine on CT26 tumor expression. (A) Representative tumor PD-L1 immunohistochemistry (magnification, ×12.5 on left and ×400 on right). (B) Immunoblots of tumor tissues (top), and protein band intensities of PD-L1 and PTEN corrected by β-actin and p-AKT corrected by t-AKT (bottom). Bars are means ± SDs (n = 5 per group). *P < 0.05. † P < 0.005. ‡ P < 0.001.

