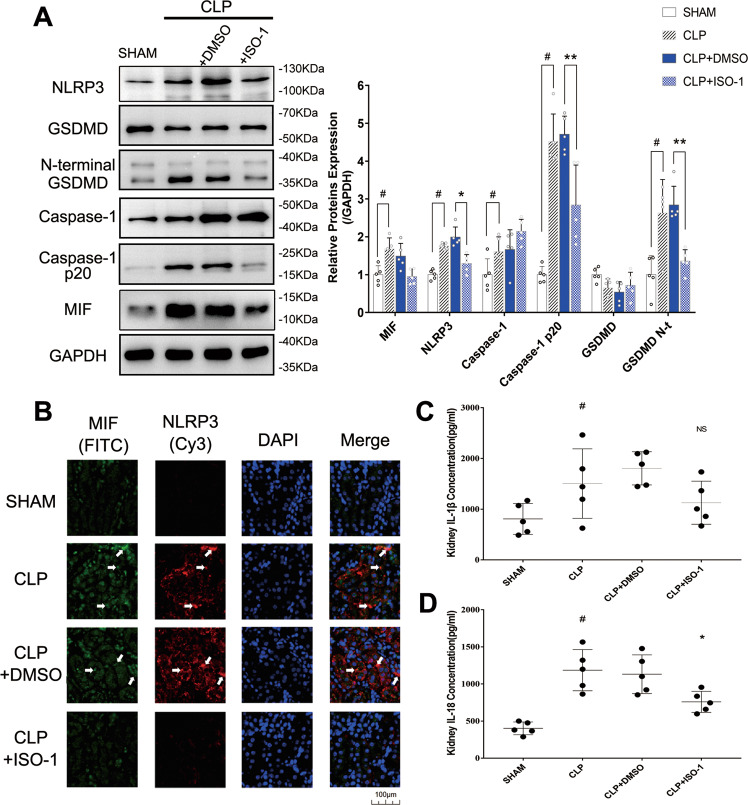
Fig. 2. The expression of pyroptosis-related proteins was measured in kidney tissue of mice of Sham, CLP, CLP + DMSO, and CLP + ISO-1 group.
A MIF, NLRP3, Caspase-1, Caspase-1 p20, Gasdermin D and its N-terminal fragments were measured by western blot. B Kidney tissues were stained via immunofluorescence. MIF was tagged by FITC (green) and NLRP3 was tagged by Cy3 (red). The white arrow pointed to the overlapped area of high fluorescence. Scale bar = 100 μm. C, D IL-1β level and IL-18 level in kidney tissue. Data were mean ± SD from five independent experiments. Each point represented an independent data. Group comparisons were performed by (A) two-way ANOVA followed by Tukey’s post hoc test and (C) (D) one-way ANOVA followed by Tukey’s post hoc test. (N = 5/group, #P < 0.05 vs Sham group, *P < 0.05 and **P < 0.01 vs CLP + DMSO group).

