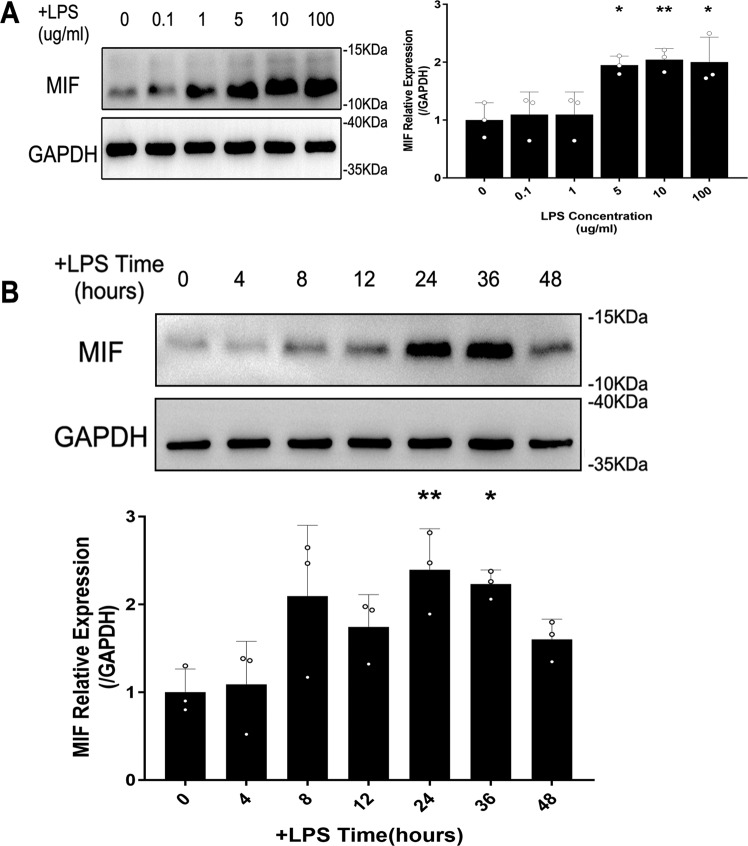
Fig. 3. The expression of MIF was measured in HK-2 cells at different LPS concentrations and time points.
A MIF expression in HK-2 cells treated by 0, 0.1, 1, 5, 10, 100 μg/ml LPS for 12 h. B MIF expression at 10 ug/ml LPS concentration for 0, 4, 8, 12, 24, 36, 48 h. Data were mean ± SD from three independent experiments. Each point represented an independent data. Group comparisons were performed by one-way ANOVA followed by Tukey’s post hoc test. (N = 3/group, *P <0.05 and **P <0.01 vs 0 μg/ml LPS dose group or 0 h +LPS group).

