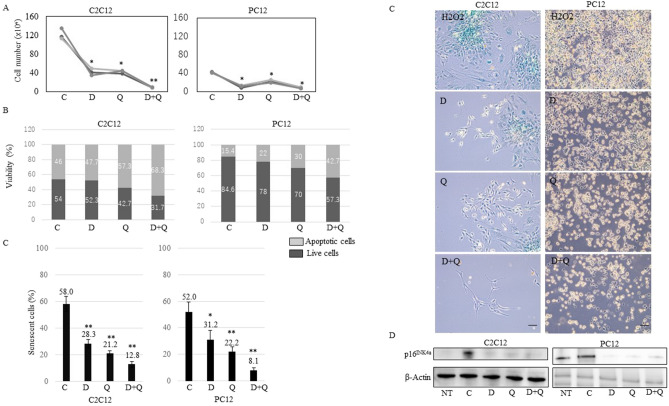
Figure 3.
(A,B) Cell number (× 104) and viability (%) of H2O2 control vehicle (C; 0.1% ethanol), D (50 nM), Q (10 μM), or D + Q (50 nM + 10 μM)-treated C2C12 and PC12 cells at 13 days after H2O2 treatment. Dark gray is live cells and light gray is apoptotic cells. (C) Percentage (%) of SABG-positive cells and images of H2O2 control vehicle (C; 0.1% ethanol), D (50 nM), Q (10 μM), or D + Q (50 nM + 10 μM)-treated C2C12 and PC12 cells at 13 days after H2O2 treatment. Scale bar, 100 μm. (D) Immunoblotting of non-treated (NT), H2O2 control vehicle (C; 0.1% ethanol), D (50 nM), Q (10 μM), or D + Q (50 nM + 10 μM)-treated C2C12 and PC12 cells using p16Ink4a and β-actin antibody. Cropped blots were used in this figure. The display of cropped gels was arranged by ChemiDoc image Lab software (Bio-Rad Laboratories). Original full-length blots are presented in Supplementary Fig. 2. SABG; senescence-associated beta-galactosidase, NT; non-treated, C; control, D; dasatinib, Q; quercetin. **p < 0.01, *p < 0.05, two-tailed Student’s t-test.

