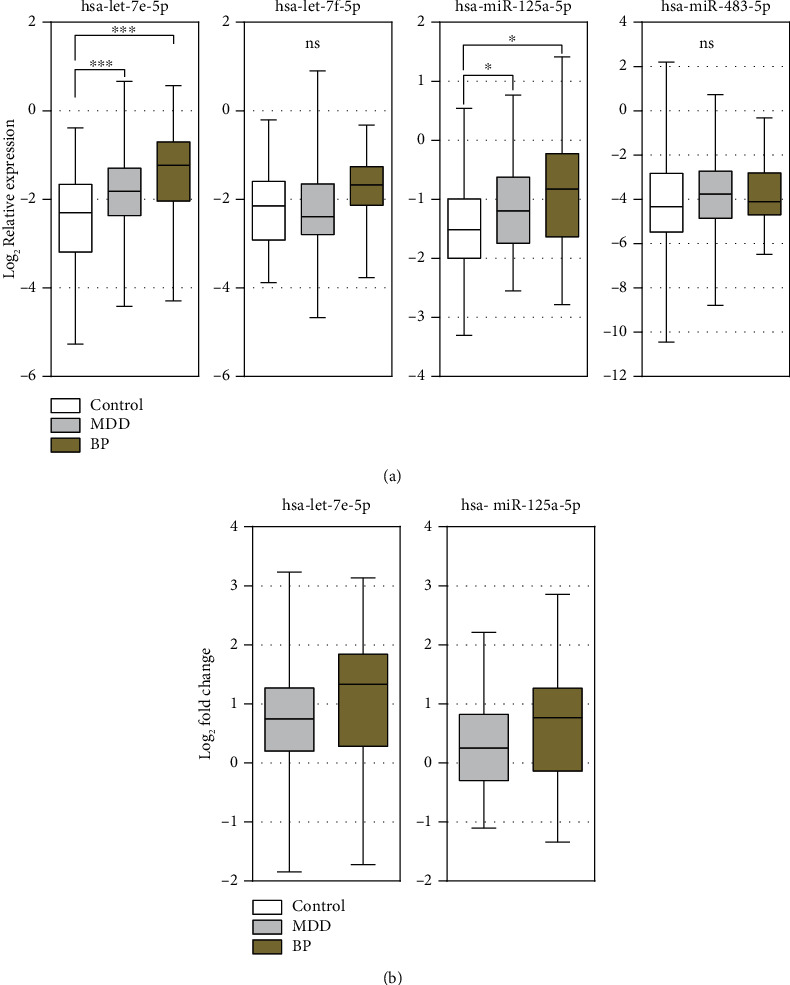
Figure 1.

Summary of hsa-let-7e-5p, hsa-let-7f-5p, hsa-miR-125a-5p, and hsa-miR-483-5p qPCR data. (a) Relative expression data shows significant changes in hsa-let-7e-5p and hsa-miR-125a-5p expressions in plasma during BD and MDD. (b) Both hsa-let-7e-5p and hsa-miR-125a-5p were upregulated by 0.75-fold and 0.25-fold, respectively, in the MDD group as well as 1.33-fold and 0.77-fold in the BD group. Mann–Whitney U test was used to evaluate differences between study groups. ∗p < 0.05, ∗∗∗p < 0.001; ns: nonsignificant.
