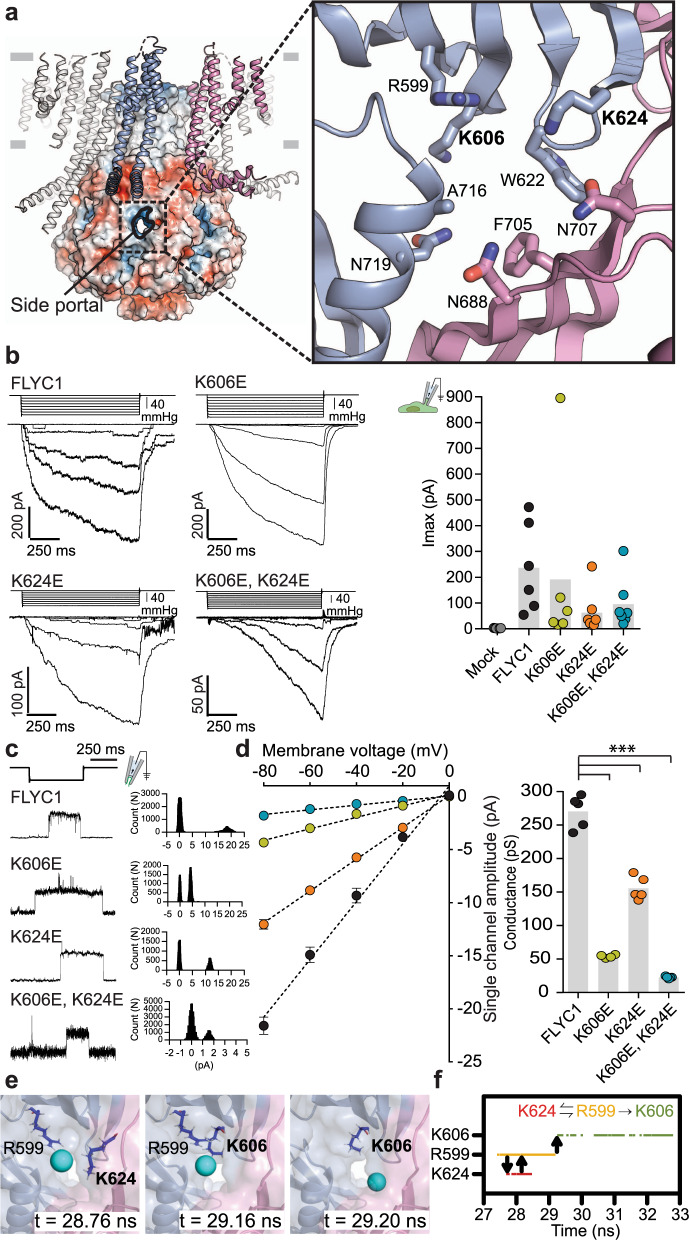
Fig. 3. Side portal of FLYC1.
a Cartoon and electrostatic surface representation of FLYC1 and cytoplasmic side portal between two subunits. Inset: expanded view of portal-lining residues as sticks. Residues selected for mutagenesis in bold. b Left, representative trace of stretch-activated currents recorded from WT or mutant FLYC1 expressing HEK-P1KO cells in cell-attached patch clamp configuration at −80mV membrane potential in response to Δ10 mmHg pipette pressure pulse. Stimulus trace illustrated above the current trace. Right, quantification of maximal current response from cells transfected with mock (N = 7), FLYC1 plasmid (N = 6), or FLYC1 plasmid with K606E (N = 6), K624E (N = 7), or K606E, K624E (N = 7) mutations. c Representative single channel traces in response to stretch from excised patches in symmetrical 150 mM NaCl at −80 mV from the indicated FLYC1 protein and their respective amplitude histograms. d Left, average I-V relationship of stretch-activated single channel currents from WT or mutant FLYC1 transfected cells. I–V data from individual cells were fit with a linear regression curve and the slope was used to measure the conductance, plotted on the right; ***p < 0.0001, Holm–Sidak’s multiple comparisons test relative to FLYC1. In panels b and d, individual cells are illustrated as scatter and mean is represented by grey bars. In left panel of d data points are mean ± S.E.M. N = number of cells tested from different experimental days. e Representative snapshots of a Cl− entering the channel via the side portal, interacting with basic residues in the vicinity. f An interaction scheme of the representative Cl− entry event depicted in (e). The proposed ladder of interaction is consistent with all Cl– entry events confirmed by inspection of each individual trajectory.

