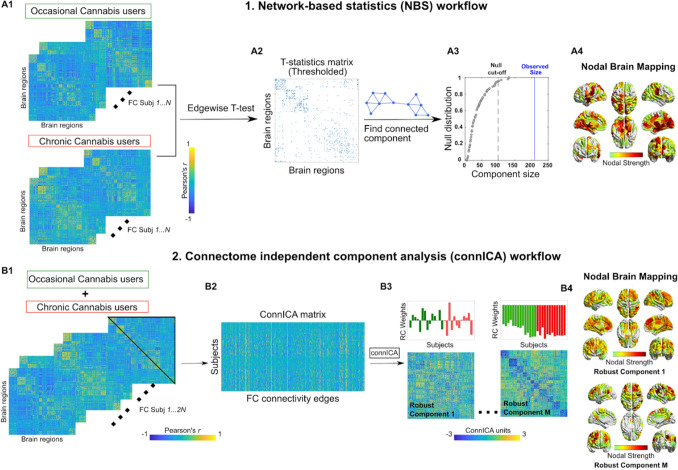
Figure 1.
Workflows of NBS (upper panel) and connICA (lower panel). (A1) NBS starts from two groups of functional connectomes, in this case from occasional and chronic cannabis users. (A2) A t-test is performed edgewise resulting in a matrix of T-statistic values. This matrix is then thresholded to yield a binarized T-statistic matrix. (A3) The giant component (largest connected component) of the T-statistic matrix is computed and its size compared with the ones obtained by doing T-statistic by randomly shuffling occasional and chronic users’ functional connectivity. The red line indicates the cut-off for declaring a component size as statistically significant (α < 0:05). The blue line shows the observed size of the component for T-matrix in A2. (A4) Brain render of the nodal strength of the regions most involved in the T-statistics. (Bottom) connICA40 workflow. (B1) The upper triangular elements of each individual functional connectivity matrix (from both occasional and chronic users) are added to (B2) a matrix whose rows indicate subjects, and columns subjects’ vectorized whole-brain functional connectomes. (B3) The ICA algorithm extracts M independent components (i.e., patterns) associated with the whole population and their relative weight in each subject. Functional connectivity, expressed as Pearson’s correlation coefficient values for individual FC matrices. The bar plots above the FC components indicate the individual prominence or amount (i.e. weights) of each extracted FC independent component in the original single-subject FC on the left side of the figure. They are color-coded according to the group membership (i.e. chronic or occasional weights). (B4) Brain render of the nodal strength of the regions most involved in a specific connICA robust component.

